Nagios在线帮助中文版
0.1.0
Nagios版权归nagios软件的著作权者所有,本书仅对中文化后内容保留著作权。需要提醒的是:无论你将采用何种方式来引用本书,全部或部分章节,请一定要给出本书的来源站点是http://nagios-cn.sourceforge.net/,并且一定引用sourceforge站点的相关出版物的版权提示与声明。
| 修订历史 | ||
|---|---|---|
| 修订 0.0.3 | 30/01/2008 | enochcytian |
| 将翻译完成的部分初步生成在线帮助文档。 | ||
| 修订 0.0.2 | 20/12/2007 | enochcytian |
| 建立DocBook工程,从源html文件反向生成xml章节文件。 | ||
| 修订 0.0.1 | 12/12/2007 | enochcytian |
| 建立初稿,开始编写初始文件。 | ||
摘要
Nagios是一款非常优秀的网络主机管理软件,它在开源社区的影响力是非同寻常的。但很可惜的是,它的界面及操作使用过程中采用了英语的语言提示与源程序紧密结合使得这款软件的汉化界面迟迟不能推出,影响了它在中文区的使用。为推进Nagios的使用,笔者建立了nagios-cn工程,该工程的主要目标是翻译源程序中运行提示、界面生成和文档说明,通过一些努力,nagios-cn终于可以正常运转了,本书编写的主要目的是为在中文使用区域推广和使用Nagios软件,让这款优秀的软件为国人服务。
相信玩计算机网络的人都或多或少地知道网络管理这一类型软件,但真正在实际中使用并以此为工作基础的人相信并不多,毕竟它不象游戏或字处理类软件那么常见。要不是某些事情所迫,我也不会尽心来了解并使用网管软件,在2004年年底,因为某些任务实在安排不下,“尚有剩余时间”的我接下研究一款网络管理软件的事情。没有最终目标,没有时间截止期限,也不会有太多的人员资金投入,但要把一些很实际的问题解决掉,这就是这些工作的起点。
好在软件并不难以安装和试用,我只花了一天就下载、编译和安装好了,试着把配置文件改了一下,也可以操作着试着用了,但操作界面丑陋、配置更新繁琐、初建系统工作量大等一系列问题使我不得不怀疑是否还需要它?毕竟有一款商业化的软件就放在手边,虽然定制得不太合乎要求,但至少没有这么繁杂的责任背身上,毕竟,我可以不为这些事情负责任的。
考虑在三,"放弃"并不是我想要做的,既然时间没有限制,那就两条腿走路吧,先稳妥地配置好那个商业化软件,让它可以操作与运转,但对后序的改动,只好开启一个记录库,不断地将问题记录下来,而对于Nagios,再清理一下思路,先看看到底我要它做些什么事情,在使用中会有多少问题需要解决,解决到什么程度,再把现有条件对比一下,看看能否走通。
不断地尝试与调整是一个漫长的过程,尤其是到着手编写检测插件的阶段,并不是象想像中的那么顺利,好在时间是挤出来的,写来写去竟然也有了些心得,顺手把Perl和BASH给练习了(只是这些插件与工作内容相关,可惜不能公开),也把几个Nagios安装和运行中常有问题给改掉了,还写了个专门给实施和运行用的BASH脚本方便后来者研究和利用它。
再往下,因为工作情况有变,把掌握的东西交付出来,让它真正有所实用。而后面再搞东西就完全是自己的兴趣了,我先后对nagios-cn项目加入了SVG格式支持、把RRD和Grapher功能整合、写SPEC以定制RPM、增加DocBook转换工程等等,每每做完这些总能让人感到有一种新鲜愉快的感受。
直到最后阶段,我才想到要宣传和推广它,也是因为脱离工作内容的关系,使我做的这些事情不再带有工作内容才有条件在网上公开,这就是后面几个网站或博客上给出的日益增多的项目信息,这本书也是其中的一部分。
Nagios是一款用于系统和网络监控的应用程序。它可以在你设定的条件下对主机和服务进行监控,在状态变差和变好的时候给出告警信息。
Nagios最初被设计为在Linux系统之上运行,然而它同样可以在类Unix的系统之上运行。
Nagios更进一步的特征包括:
- 监控网络服务(SMTP、POP3、HTTP、NNTP、PING等);
- 监控主机资源(处理器负荷、磁盘利用率等);
- 简单地插件设计使得用户可以方便地扩展自己服务的检测方法;
- 并行服务检查机制;
- 具备定义网络分层结构的能力,用"parent"主机定义来表达网络主机间的关系,这种关系可被用来发现和明晰主机宕机或不可达状态;
- 当服务或主机问题产生与解决时将告警发送给联系人(通过EMail、短信、用户定义方式);
- 具备定义事件句柄功能,它可以在主机或服务的事件发生时获取更多问题定位;
- 自动的日志回滚;
- 可以支持并实现对主机的冗余监控;
- 可选的WEB界面用于查看当前的网络状态、通知和故障历史、日志文件等;
Nagios所需要的运行条件是机器必须可以运行Linux(或是Unix变种)并且有C语言编译器。你必须正确地配置TCP/IP协议栈以使大多数的服务检测可以通过网络得以进行。
你需要但并非必须正确地配置Nagios里的CGIs程序,而一旦你要使用CGI程序时,你必须要安装以下这些软件...
Nagios版权遵从于由自由软件基金会所发布的GNU版权协议第二版。有关GNU协议请查阅自由软件基金会网站。该版权协议允许你在某些条件下可以复制、分发并且或者是修改它。可以在Nagios软件发行包里阅读版权文件LICENSE或是在网站上阅读在线版权文件以获取更多信息。
Nagios is provided AS IS with NO WARRANTY OF ANY KIND, INCLUDING THE WARRANTY OF DESIGN, MERCHANTABILITY, AND FITNESS FOR A PARTICULAR PURPOSE.
一些人对Nagios的发布尽力,不管是报告错误、提供建议、编写插件等等,可以在网站http://www.nagios.org上找到这些人的名字列表。
可以在Nagioshttp://www.nagios.org站点获取最新版本。
注意
Nagios及Nagios商业标识由Ethan Galstad所拥有。其他的商业标识、服务标识、注册商标及注册服务属于各自的所有者。
重要
Important: Make sure you read through the documentation and the FAQs at http://www.nagios.org/ before sending a question to the mailing lists.
Nagios的更新日志可以在这里的在线文件或是在源程序的发行包的根目录里找到。
- 文档:
- 更新了文档 - 很抱歉我对文档的更新工作进展迟缓。这会花些时间来做,因为有很多文档而且写这些文档并不是我喜欢的事情(我更不喜欢整天翻译,这也不是我喜欢的事情)。期待一些文档与其他的有所不同,而这些不同会对于那些新人或有经验的Nagios使用者起些作用。
- 内嵌宏:
- 新加宏 - 加入了一些新宏,包括:$TEMPPATH$、$LONGHOSTOUTPUT$、$LONGSERVICEOUTPUT$、$HOSTNOTIFICATIONID$、$SERVICENOTIFICATIONID$、$HOSTEVENTID$、$SERVICEEVENTID$、$SERVICEISVOLATILE$、$LASTHOSTEVENTID$、$LASTSERVICEEVENTID$、$HOSTDISPLAYNAME$、$SERVICEDISPLAYNAME$、$MAXHOSTATTEMPTS$、$MAXSERVICEATTEMPTS$、$TOTALHOSTSERVICES$、$TOTALHOSTSERVICESOK$、$TOTALHOSTSERVICESWARNING$、$TOTALHOSTSERVICESUNKNOWN$、$TOTALHOSTSERVICESCRITICAL$、$CONTACTGROUPNAME$、$CONTACTGROUPNAMES$、$CONTACTGROUPALIAS$、$CONTACTGROUPMEMBERS$、$NOTIFICATIONRECIPIENTS$、$NOTIFICATIONISESCALATED$、$NOTIFICATIONAUTHOR$、$NOTIFICATIONAUTHORNAME$、$NOTIFICATIONAUTHORALIAS$、$NOTIFICATIONCOMMENT$、$EVENTSTARTTIME$、$HOSTPROBLEMID$、$LASTHOSTPROBLEMID$、$SERVICEPROBLEMID$、$LASTSERVICEPROBLEMID$、$LASTHOSSTATE$、$LASTHOSTSTATEID$、$LASTSERVICESTATE$、$LASTSERVICESTATEID$。加入了两个特殊的守护时间宏:$ISVALIDTIME:$和$NEXTVALIDTIME:$。
- 移除的宏 - 原有的宏$NOTIFICATIONNUMBER$被分离为两个新宏$HOSTNOTIFICATIONNUMBER$和$SERVICENOTIFICATIONNUMBER$。
- 变更的宏 - 现有的$HOSTNOTES$和$SERVICENOTES$宏包括自身外,还包括$HOSTNOTESURL$、$HOSTACTIONURL$、$SERVICENOTESURL$和$SERVICEACTIONURL$等几个宏。
- 在检测、事件句柄处理、告警和其他外部命令执行时,宏可以获取环境变量。这可会使Nagios在大型部署方案时占用较高的CPU处理能力,你可以设置enable_environment_macros 选项来不使能它。
- 有关宏的更新信息可以在这里查到。
- 预定义停机时间:
- 预定义停机时间不再保存在各自文件(之前是由主配置文件里的downtime_file来指定)。当前的和保留的预定义停机时间将分别保存于状态文件和保留文件retention file中。
- 注释:
- 主机和服务的注释不再保存于各自的文件(之前在主配置文件中的comment_file来指定)。当前的和保留的注释将分别保存于状态文件status file和保留文件retention file之中。
- Acknowledgement comments that are marked as non-persistent are now only deleted when the acknowledgement is removed. They were previously automatically deleted when Nagios restarted, which was not ideal.
- State Retention Data:
- Status information for individual contacts is now retained across program restarts.
- Comment and downtime IDs are now retained across program restarts and should be unique unless the retention data is deleted or ignored.
- Added retained_host_attribute_mask and retained_service_attribute_mask variables to control what host/service attributes are retained globally across program restarts.
- Added retained_process_host_attribute_mask and retained_process_service_attribute_mask variables to control what process attributes are retained across program restarts.
- Added retained_contact_host_attribute_mask and retained_contact_service_attribute_mask variables to control what contact attributes are retained globally across program restarts.
- Flap Detection:
- Added flap_detection_options directive to host and service definitions to allow you to specify what host/service states should be used by the flap detection logic (by default all states are used).
- Percent state change and state history are now retained and recorded even when flap detection is disabled.
- Hosts and services are immediately checked for flapping when flap detection is enabled program-wide.
- Hosts and services that are flapping when flap detection is disabled program-wide are now logged.
- More information on flap detection can be found here.
- External Commands:
- Added a new PROCESS_FILE external command to allow processing of external commands found in an eternal (regular) file. Useful for processing large amounts of passive checks with long output, or for scripting regular commands. More information can be found here.
- Custom commands may now be submitted to Nagios. Custom command names are prefixed with an underscore and are not processed internally by the Nagios daemon. They may, however, be processed by a loaded NEB module.
- The check_external_commands option is now enabled by default, which means Nagios is configured to check for external "commands out of the box". All 2.x and earlier versions of Nagios had this option disabled by default.
- Status Data:
- Embedded Perl:
- Added new enable_embedded_perl and use_embedded_perl_implicitly variables to control use of the embedded Perl interpreter.
- Perl scripts/plugins can now explicitly tell Nagios whether or not they should be run under the embedded Pel interpreter. This is useful if you have troublesome scripts that don't function well under the ePN.
- More information about these new optios can be found here.
- Adaptive Monitoring:
- The check timeperiod for hosts and services can now be modified on-the-fly with the appropriate external command (CHANGE_HOST_CHECK_TIMEPERIOD or CHANGE_SVC_CHECK_TIMEPERIOD).查阅这个网页以取得更多可用的适应性检测命令。
- Notifications:
- A first_notification_delay option has been added to host and service definitions to (what else) introduce a delay between when a host/service problem first occurs and when the first problem notification goes out. In previous versions you had to use some mighty config-fu with escalations to accomplish this. Now this feature is available to normal mortals.
- Notifications are now sent out for hosts/services that are flapping when flap detection is disabled on a host- or service-specific basis or on a program-wide basis. The $NOTIFICATIONTYPE$ macro will be set to "FLAPPINGDISABLED" in this situation.
- Notifications can now be sent out when scheduled downtime start, ends, and is cancelled for hosts and services. The $NOTIFICATIONTYPE$ macro will be set to "DOWNTIMESTART", "DOWNTIMEEND", or "DOWNTIMECANCELLED", respectively. In order to received notifications on scheduled downtime events, specify "s" or "downtime" in your contact, host, and/or service notification options.
- More information on notifications can be found here.
- Object Definitions:
- Service dependencies can now be created to easily define "same host" dependencies for different services on one or more hosts. (Read more)
- Extended host and service definitions (hostextinfo and serviceextinfo, respectively) have been deprecated. All values that from extended definitions have been merged with host or service definitions, as appropriate. Nagios 3 will continue to read and process older extended information definitions, but will log a warning. Future versions of Nagios (4.x and later) will not support separate extended info definitions.
- New hostgroup_members, servicegroup_members, and contactgroup_members directives have been added to hostgroup, servicegroup, and contactgroups definitions, respectively. This allows you to include hosts, services, or contacts from sub-groups in your group definitions.
- New notes, notes_url, and action_url have been added to hostgroup and servicegroup definition.
- Contact definitions have the new host_notifications_enabled, service_notifications_enabled, and can_submit_commands directives to better control notifications and determine whether or not they can submit commands through the web interface.
- Host and service dependencies now support an optional dependency_period directive. This allows you to limit the times during which dependencies are valid.
- The parallelize directive in service definitions is now deprecated and no longer used. All service checks are run in parallel in Nagios 3.
- There are no longer any inherent limitations on the length of host names or service descriptions.
- Extended regular expressions are now used if you enable the use_regexp_matching config option. Regular expression matching is only used in certain object definition directives that contain *, ?, +, or \..
- A new initial_state directive has been added to host and service definitions, so you can tell Nagios that a host/service should default to a specific state when Nagios starts, rather than UP or OK (which is still the default).
- Object Inheritance:
- You can now inherit object variables/values from multiple templates by specifying more than one template name in the use directive of object definitions. This can allow for some very powerful (and complex) inheritance setups. (Read more)
- Services now inherit contact groups, notification interval, and notification period from their associated host if not otherwise specified. (Read more)
- Host and service escalations now inherit contact groups, notification interval, and escalation timeperiod fro their associated host or service if not otherwise specified. (Read more)
- String variables in host, service, and contact definitions can now be prevented from being inherited by specifying a value of "null" (without quotes) for the value of the variable. (Read more)
- Most string variables in local object definitions can now be appended to the string values that are inherited. This is quite handy in large configurations. (Read more)
- Performance Improvements:
- Add ability to precache object config files and exclude circular path detection checks from verification process. This can speed up Nagios start time immensely in large environments! Read more here.
- A new use_large_installation_tweaks option has been added that should improve performance in large Nagios installations. Read more about this here.
- A number of internal improvements have been made with regards to how Nagios deals with internal data structures and object (e.g. host and service) relationships. These improvements should result in a speedup for larger installations.
- New external_command_buffer_slots option has been added to allow you to more easily scale Nagios in large environments. For best results you should consider using MRTG to graph Nagios' usage of buffer slots over time.
- Plugin Output:
- Multiline plugin output is now supported for host and service checks. Hooray! The plugin API has been updated to support multiple lines of output in a manner that retains backward compatability with older plugins. Additional lines of output (aside from the first line) are now stored in new $LONGHOSTOUTPUT$ and $LONGSERVICEOUTPUT$ macros.
- The maximum length of plugin output has been increased to 4K (from around 350 bytes in previous versions). This 4K limit has been arbitrarily chosen to protect again runaway plugins that dump back too much data to Nagios.
- More information on the plugins, multiline output, and max plugin output length can be found here.
- Service Checks:
- Nagios now checks for orphaned service checks by default.
- Added a new enable_predictive_service_dependency_checks option to control whether or not Nagios will initiate predictive check of service that are being depended upon (in dependency definitions). Predictive checks help ensure that the dependency logic is as accurate as possible. (Read more)
- A new cached service check feature has been implemented that can significantly improve performance for many people Instead of executing a plugin to check the status of a service, Nagios can often use a cached service check result instead. More information on this can be found here.
- Host Checks:
- Host checks are now run in parallel! Host checks used to be run in a serial fashion, which meant they were a major holdup in terms of performance. No longer! (Read more)
- Host check retries are now performed like service check retries. That is to say, host definitions now have a new retry_interval that specifies how much time to wait before trying the host check again. :-)
- Regularly scheduled host checks now longer hinder performance. In fact, they can help to increase performance with the new cached check logic (see below).
- Added a new check_for_orphaned_hosts option to enable checks of orphaned host checks. This is need now that host checks are run in parallel.
- Added a new enable_predictive_host_dependency_checks option to control whether or not Nagios will initiate predictive check of hosts that are being depended upon (in dependency definitions). Predictive checks help ensure that the dependency logic is as accurate as possible. (Read more)
- A new cached host check feature has been implemented that can significantly improve performance for many people Instead of executing a plugin to check the status of a host, Nagios can often use a cached host check result instead. More information on this can be found here.
- Passive host checks that have a DOWN or UNREACHABLE result can now be automatically translated to their proper state from the point of view of the Nagios instance that receives them. This is very useful in failover and distributed monitoring setups. More information on passive host check state translation can be found here.
- Passive host checks normally put a host into a HARD state. This can now be changed by enabling the passive_host_checks_are_soft option.
- Freshness checks:
- A new additional_freshness_latency option has been added to allow to you specify the number of seconds that should be added to any host or service freshness threshold that is automatically calculated by Nagios.
- IPC:
- The IPC mechanism that is used to transfer host/service check results back to the Nagios daemon from (grand)child processes has changed! This should help to reduce load/latency issues related to processing large numbers of passive checks in distributed monitoring environments.
- Check results are now transferred by writing check results to files in directory specified by the check_result_path option. Files that are older that the max_check_result_file_age option will be mercilessly deleted without further processing.
- Timeperiods:
- Timeperiods were overdue for a major overhaul and have finally been extended to allow for date exceptions, skip dates (every 3 days), etc! This should help you out when defining notification timeperiods for pager rotations.
- More information on the new timeperiod directives can be found here and here.
- Event Broker:
- Updated NEB API version
- Modified callback for adaptive program status data
- Added callback for adaptive contact status data
- Added precheck callbacks for hosts and services to allow modules to cancel/override internal host/service checks.
- Web Interface:enable_splunk_integrationsplunk_url
- Hostgroup and servicegroup summaries now show important/unimportant problem breakdowns liek the TAC CGI.
- Minor layout changes to host and service detail views in extinfo CGI.
- New check statistics and have been added to the "Performance Info" screen.
- Added Splunk
- Added new notes_url_target and action_url_target options to control what frame notes and action URLs are opened in.
- Added new lock_author_names option to prevent alteration of author names when users submit comments, acknowledgements, and scheduled downtime.
- Deubbing Info:
- The DEBUGx compile options available in the configure script for have been removed.
- Debugging information can now be written to a separate debug file, which is automatically rotated when it reaches a user-defined size. This should make debugging problems much easier, as you don't need to recompiled Nagios. Full support for writing debugging information to file is being added during the alpha development phase, so it may not be complete when you try it.
- Variables that affect the debug log in debug_file, debug_level, debug_verbosity, and max_debug_file_size.
- Misc:
- Temp path variable - A new temp_path variable has been added to specify a scratch directory that Nagios can use for temporary scratch space.
- Unique notification and event ID numbers - A unique ID number is now assigned to each host and service notification. Another unique ID is now assigned to all host and service state changes as well. The unique IDs can be accessed using the following respective macros: $HOSTNOTIFICATIONID$, $SERVICENOTIFICATIONID$, $HOSTEVENTID$, $SERVICEEVENTID$, $LASTHOSTEVENTID$, $LASTSERVICEEVENTID$.
- New macros - A few new macros (other than those already mentioned elsewhere above) have been added. They include $HOSTGROUPNAMES$, $SERVICEGROUPNAMES$, $HOSTACKAUTHORNAME$, $HOSTACKAUTHORALIAS$, $SERVICEACKAUTHORNAME$, and $SERVICEACKAUTHORALIAS$.
- Reaper frequency - The old service_reaper_frequency variable has been renamed to check_result_reaper_frequency, as it is now also used to process host check results.
- Max reaper time - A new max_check_result_reaper_time variable has been added to limit the amount of time a single reaper event is allowed to run.
- Fractional intervals - Fractional notification and check intervals (e.g. "3.5" minutes) are now supported in host, service, host escalation, and service escalation definitions.
- Escaped command arguments - You can now pass bang (!) characters in your command arguments by escaping them with a backslash (\). If you need to include backslashes in your command arguments, they should also be escaped with a backslash.
- Multiline system command output - Nagios will now read multiple lines out output from system commands it runs (notification scripts, etc.), up to 4K. This matches the limits on plugin output mentioned earliar. Output from system commands is not directly processed by Nagios, but support for it is there nonetheless.
- Better scheduling information - More detailed information is given when Nagios is executed with the -s command line option. This information can be used to help reduce the time it takes to start/restart Nagios.
- Aggregated status file updates - The old aggregate_status_updates option has been removed. All status file updates are now aggregated at a minimum interval of 1 second.
- New performance data file mode - A new "p" option has been added to the host_perfdata_file_mode and service_perfdata_file_mode options. This new mode will open the file in non-blocking read/write mode, which is useful for pipes.
- Timezone offset - A new use_timezone option has been added to allow you to run different instances of Nagios in timezones different from the local zone.
祝贺你选择了Nagios!Nagios是一个非常强大且柔性化的软件,但可能需要不少心血来学习如何配置使之符合你所需,一旦掌握了它如何工作并怎样来工作时,你会觉得再也离不开它! :-) 对于初次使用Nagios的新手这有几个建议需要遵从:
- 放松点 - 这会花些时间。不要指望它事情可以在转瞬间就搞掟,没有那么容易。设置好Nagios是一个费点事的工作,部分是由于对Nagios设置并不清楚,而还可能是由于并不清楚如何来监控现有网络(或者说如何监控会更好)。
- 使用快速上手指南。本帮助给出了快速安装指南是给那些新手尽快地将Nagios安装到位并运行起来而写就的。在不到二十分钟之内可以安装并监控本地的系统,一旦完成了,就可以继续学习配置Nagios了。
- 阅读文档。如果掌握Nagios运行机制,可以高效地配置它并且使之无所不能。确信已经阅读了这些文档(是“配置Nagios”和“基本操作”两章)。在更好地理解基础性配置之前可以对那些高级内容暂时不管。
- 获得他人协助。如果已经阅读文档并检测了样本配置文件但仍然有问题,写一个EMail给nagios-users邮件列表并写清楚问题。由于在这个项目上我有不少事情要做,直接给我的邮件我可能无法回复,所以最好是求助于邮件列表,如果有较好的背景并且可以将问题描述清楚,或许有人可以指出如何正确来做。更多地信息请在这个链接http://www.nagios.org/support/下寻找。
目录
如果是使用3.x的旧版,肯定是要尽快升级到当前版本。新版本修正了许多错误,下面假定已经根据快速安装指南的操作步骤从源代码包开始安装好Nagios,下面可以安装更新的版本。虽然下面的操作都是用root操作的,但可以不用root权限也可以升级成功。下面是升级过程...
先确认已经备份好现有版本的Nagios软件和配置文件。如果升级过程中有不对的,至少可以回退到旧版本。
切换为Nagios用户。使用Debian/Ubuntu系统的可以用sudo -s nagios来切换。
su -l nagios
下载最新的Nagios安装包(http://www.nagios.org/download/)。
wget http://osdn.dl.sourceforge.net/sourceforge/nagios/nagios-3.x.tar.gz展开源码包。
tar xzf nagios-3.x.tar.gz
cd nagios-3.x
运行Nagios源程序的配置脚本,把加入外部命令的组名加上,象这样:
./configure --with-command-group=nagcmd
编译源程序
make all
安装升级后的二进制程序、文档和Web接口程序。在这步时旧配置文件还不会被覆盖。
make install
验证配置并重启动Nagios
/usr/local/nagios/bin/nagios -v /usr/local/nagios/etc/nagios.cfg
/sbin/service nagios restart
好了,升级完成!
Nagios从2.x升级到3.x并不难。升级过程如同上面的旧版3.x的升级过程。但是Nagios3.x中有几处配置文件的改动需要注意:
- The old service_reaper_frequency variable in the main config file has been renamed to check_result_reaper_frequency.
- The old $NOTIFICATIONNUMBER$ macro has been deprecated in favor of new $HOSTNOTIFICATIONNUMBER$ and $SERVICENOTIFICATIONNUMBER$ macros.
- The old parallelize directive in service definitions is now deprecated and no longer used, as all service checks are run in parallel.
- The old aggregate_status_updates option has been removed. All status file updates are now aggregated at a minimum interval of 1 second.
- Extended host and extended service definitions have been deprecated. They are still read and processed by Nagios, but it is recommended that you move the directives found in these definitions to your host and service definitions, respectively.
- The old downtime_file file variable in the main config file is no longer supported, as scheduled downtime entries are now saved in the retention file. To preserve existing downtime entries, stop Nagios 2.x and append the contents of your old downtime file to the retention file.
- The old comment_file file variable in the main config file is no longer supported, as comments are now saved in the retention file. To preserve existing comments, stop Nagios 2.x and append the contents of your old comment file to the retention file.
Also make sure to read the "What's New" section of the documentation. It describes all the changes that were made to the Nagios 3 code since the latest stable release of Nagios 2.x. Quite a bit has changed, so make sure you read it over.
如果当前是用RPM包安装的,或是用Debian/Ubuntu的APT软件包来安装Nagios的,需要用源程序包来安装升级,下面是操作步骤:
- Main config file (usually nagios.cfg)
- Resource config file (usually resource.cfg)
- CGI config file (usually cgi.cfg)
- All your object definition files
- Configuration files
- Retention file (usually retention.dat)
- Current Nagios log file (usually nagios.log)
- Archived Nagios log files
- Backup your existing Nagios installation
- Uninstall the original RPM or APT package
- Install Nagios from source by following the quickstart guide
- Restore your original Nagios configuration files, retention file, and log files
- Verify your configuration and start Nagios
注意RPM和APT包把Nagios的文件放置的位置有所不同。在升级前要确保那些配置文件备份好以在碰到解决不了的升级问题时可以回退到旧版本。
现在可以提供如下Linux发行版本上的快速安装指南:
你可以在NagiosCommunity.org的维基百科上找到更多的安装上手指南。什么?找不到你所用的操作系统版本的指南?在维基百科上给其他人写一条吧!
如果你在一个上面没列出的操作系统或Linux发行包上安装Nagios,请参照Fedora快速指南来概要地了解一下你需要做的事情。命令名、路径等可能因不同的发行包或操作系统而不同,因而这时你可能需要些努力来搞一下安装文档里的东西。
一旦你正确地安装并使Nagios运行起来后,毫无疑问你不仅要监控你的主机,你需要审视一下更多的文档来做更多的事情...
本指南试图让你通过简单的指令以在20分钟内在Fedora平台上通过对Nagios的源程序的安装来监控本地主机。这里没有讨论更高级的设置项 - 只是一些基本操作,但这足以使95%的用户启动Nagios。
这些指令在基于Fedora Core 6的系统下写成的。
最终结果是什么
如果按照本指南安装,最后将是这样结果:
- Nagios和插件将安装到/usr/local/nagios
- Nagios将被配置为监控本地系统的几个主要服务(CPU负荷、磁盘利用率等)
- Nagios的Web接口是URL是http://localhost/nagios/
在做安装之前确认要对该机器拥有root权限。
确认你安装好的Fedora系统上已经安装如下软件包再继续。
- Apache
- GCC编译器
- GD库与开发库
可以用yum命令来安装这些软件包,键入命令:
yum install httpd
yum install gcc
yum install glibc glibc-common
yum install gd gd-devel
1)建立一个帐号
切换为root用户
su -l
创建一个名为nagios的帐号并给定登录口令
/usr/sbin/useradd nagios
passwd nagios
创建一个用户组名为nagcmd用于从Web接口执行外部命令。将nagios用户和apache用户都加到这个组中。
/usr/sbin/groupadd nagcmd
/usr/sbin/usermod -G nagcmd nagios
/usr/sbin/usermod -G nagcmd apache
2)下载Nagios和插件程序包
建立一个目录用以存储下载文件
mkdir ~/downloads
cd ~/downloads
下载Nagios和Nagios插件的软件包(访问http://www.nagios.org/download/站点以获得最新版本),在写本文档时,最新的Nagios的软件版本是3.0rc1,Nagios插件的版本是1.4.11。
wget http://osdn.dl.sourceforge.net/sourceforge/nagios/nagios-3.0rc1.tar.gz
wget http://osdn.dl.sourceforge.net/sourceforge/nagiosplug/nagios-plugins-1.4.11.tar.gz
3)编译与安装Nagios
展开Nagios源程序包
cd ~/downloads
tar xzf nagios-3.0rc1.tar.gz
cd nagios-3.0rc1
运行Nagios配置脚本并使用先前开设的用户及用户组:
./configure --with-command-group=nagcmd
编译Nagios程序包源码
make all
安装二进制运行程序、初始化脚本、配置文件样本并设置运行目录权限
make install
make install-init
make install-config
make install-commandmode
现在还不能启动Nagios-还有一些要做的...
4)客户化配置
样例配置文件默认安装在这个目录下/usr/local/nagios/etc,这些样例文件可以配置Nagios使之正常运行,只需要做一个简单的修改...
用你擅长的编辑器软件来编辑这个/usr/local/nagios/etc/objects/contacts.cfg配置文件,更改email地址nagiosadmin的联系人定义信息中的EMail信息为你的EMail信息以接收报警内容。
vi /usr/local/nagios/etc/objects/contacts.cfg
5)配置WEB接口
安装Nagios的WEB配置文件到Apache的conf.d目录下
make install-webconf
创建一个nagiosadmin的用户用于Nagios的WEB接口登录。记下你所设置的登录口令,一会儿你会用到它。
htpasswd -c /usr/local/nagios/etc/htpasswd.users nagiosadmin
重启Apache服务以使设置生效。
service httpd restart
6)编译并安装Nagios插件
展开Nagios插件的源程序包
cd ~/downloads
tar xzf nagios-plugins-1.4.11.tar.gz
cd nagios-plugins-1.4.11
编译并安装插件
./configure --with-nagios-user=nagios --with-nagios-group=nagios
make
make install
7)启动Nagios
把Nagios加入到服务列表中以使之在系统启动时自动启动
chkconfig --add nagios
chkconfig nagios on
验证Nagios的样例配置文件
/usr/local/nagios/bin/nagios -v /usr/local/nagios/etc/nagios.cfg
如果没有报错,可以启动Nagios服务
service nagios start
8)更改SELinux设置
Fedora与SELinux(安全增强型Linux)同步发行与安装后将默认使用强制模式。这会在你尝试联入Nagios的CGI时导致一个"内部服务错误"消息。
如果是SELinux处于强制安全模式时需要做
getenforce
令SELinux处于容许模式
setenforce 0
如果要永久性更变它,需要更改/etc/selinux/config里的设置并重启系统。
不关闭SELinux或是永久性变更它的方法是让CGI模块在SELinux下指定强制目标模式:
chcon -R -t httpd_sys_content_t /usr/local/nagios/sbin/
chcon -R -t httpd_sys_content_t /usr/local/nagios/share/
更多有关Nagios的CGI模块增加目标策略的强制权限方式见NagiosCommunity.org的维基百科http://www.nagioscommunity.org/wiki。
9)登录WEB接口
你现在可以从WEB方式来接入Nagios的WEB接口了,你需要在提示下输入你的用户名(nagiosadmin)和口令,你刚刚设置的,这里用系统默认安装的浏览器,用下面这个超链接
http://localhost/nagios/
点击“服务详情”的引导超链来查看你本机的监视详情。你可能需要给点时间让Nagios来检测你机器上所依赖的服务因为检测需要些时间。
10)其他的变更
确信你机器的防火墙规则配置允许你可以从远程登录到Nagios的WEB服务。
配置EMail的报警项超出了本文档的内容,指向你的系统档案用网页查找或是到这个站点NagiosCommunity.org wiki来查找更进一步的信息,以使你的系统上可以向外部地址发送EMail信息。更多有关通知的信息可以查阅这篇文档。
11)完成了
祝贺你已经成功安装好Nagios,但网络监控工作只是刚开始。毫无疑问你不是只监控本地系统,所以要看以下这些文档...
- 对Windows主机的监控
- 对Linux/Unix主机的监控
- 对Netware服务器的监控
- 监控路由器和交换机
- 监控公众化服务(HTTP、FTP、SSH等)
本指南试图让你通过简单的指令以在20分钟内在你的openSUSE平台上通过对Nagios的源程序的安装来监控本地主机。这里没有讨论更高级的设置项 - 只是一些基本操作,但这足以使95%的用户启动Nagios。
这些指令在基于openSUSE10.2的系统下写成的。
1)建立一个帐号
切换为root用户
su -l
创建新帐户名为nagios并给它一个登录口令
/usr/sbin/useradd nagios
passwd nagios
创建一个用户组名为nagios,并把nagios帐户加入该组
/usr/sbin/groupadd nagios
/usr/sbin/usermod -G nagios nagios
创建一个用户组名为nagcmd来执行外部命令并可以通过WEB接口来执行。将nagios用户和apache用户都加到这个组中。
/usr/sbin/groupadd nagcmd
/usr/sbin/usermod -G nagcmd nagios
/usr/sbin/usermod -G nagcmd wwwrun
2)下载Nagios和插件程序包
建立一个目录用以存储下载文件
mkdir ~/downloads
cd ~/downloads
下载Nagios和Nagios插件的软件包(访问http://www.nagios.org/download/站点以获得最新版本),在写本文档时,最新的Nagios的软件版本是3.0rc1,Nagios插件的版本是1.4.11。
wget http://osdn.dl.sourceforge.net/sourceforge/nagios/nagios-3.0rc1.tar.gz
wget http://osdn.dl.sourceforge.net/sourceforge/nagiosplug/nagios-plugins-1.4.11.tar.gz
3)编译与安装Nagios
展开Nagios源程序包
cd ~/downloads
tar xzf nagios-3.0rc1.tar.gz
cd nagios-3.0rc1
运行Nagios配置脚本并使用先前开设的用户及用户组:
./configure --with-command-group=nagcmd
编译Nagios程序包源码
make all
安装二进制运行程序、初始化脚本、配置文件样本并设置运行目录权限
make install
make install-init
make install-config
make install-commandmode
现在还不能启动Nagios - 还有一些要做的...
4)客户化配置
样例配置文件默认安装在这个目录下/usr/local/nagios/etc,这些样例文件可以配置Nagios使之正常运行,只需要做一个简单的修改...
用你擅长的编辑器软件来编辑这个/usr/local/nagios/etc/objects/contacts.cfg配置文件,更改email地址nagiosadmin的联系人定义信息中的EMail信息为你的EMail信息以接收报警内容。
vi /usr/local/nagios/etc/objects/contacts.cfg
5)配置WEB接口
安装Nagios的WEB配置文件到Apache的conf.d目录下
make install-webconf
创建一个nagiosadmin的用户用于Nagios的WEB接口登录。记下你所设置的登录口令,一会儿你会用到它。
htpasswd2 -c /usr/local/nagios/etc/htpasswd.users nagiosadmin
重启Apache服务以使设置生效。
service apache2 restart
6)编译并安装Nagios插件
展开Nagios插件的源程序包
cd ~/downloads
tar xzf nagios-plugins-1.4.11.tar.gz
cd nagios-plugins-1.4.11
编译并安装插件
./configure --with-nagios-user=nagios --with-nagios-group=nagios
make
make install
7)启动Nagios
把Nagios加入到服务列表中以使之在系统启动时自动启动
chkconfig --add nagios
chkconfig nagios on
验证Nagios的样例配置文件
/usr/local/nagios/bin/nagios -v /usr/local/nagios/etc/nagios.cfg
如果没有报错,可以启动Nagios服务
service nagios start
8)登录WEB接口
你现在可以从WEB方式来接入Nagios的WEB接口了,你需要在提示下输入你的用户名(nagiosadmin)和口令,你刚刚设置的,这里用系统默认安装的浏览器,用下面这个超链接
konqueror http://localhost/nagios/
点击“服务详情”的引导超链来查看你本机的监视详情。你可能需要给点时间让Nagios来检测你机器上所依赖的服务因为检测需要些时间。
9)其他的变更
确信你机器的防火墙规则配置允许你可以从远程登录到Nagios的WEB服务。
你可以这样做:
- 打开控制中心
- 选择'打开超户设置'以打开YaST超户控制中心
- 选择在'安全与用户'设置里的'防火墙'
- 在防火墙的配置窗口中点击'允许的服务'选项
- 在许可的服务中增加'HTTP服务',是'外部区'的部分
- 点击'下一步'并选择'接受'以使得防火墙设置生效
配置EMail的报警项超出了本文档的内容,指向你的系统档案用网页查找或是到这个站点NagiosCommunity.org wiki来查找更进一步的信息,以使你的openSUSE系统上可以向外部地址发送EMail信息。
本指南试图让你通过简单的指令以在20分钟内在Ubuntu平台上通过对Nagios的源程序的安装来监控本地主机。没有讨论更高级的设置项-只是一些基本操作,但这足以使95%的用户启动Nagios。
这些指令在基于Ubuntu6.10(桌面版)的系统下写成的。
What You'll End Up With
如果按照本指南安装,最后将是这样结果:
- Nagios和插件将安装到/usr/local/nagios
- Nagios将被配置为监控本地系统的几个主要服务(CPU负荷、磁盘利用率等)
- Nagios的Web接口是URL是http://localhost/nagios/
确认你安装好的系统上已经安装如下软件包再继续。
- Apache2
- GCC编译器与开发库
- GD库与开发库
可以用apt-get命令来安装这些软件包,键入命令:
sudo apt-get install apache2
sudo apt-get install build-essential
sudo apt-get install libgd2-dev
1)建立一个帐号
切换为root用户
sudo -s
创建一个名为nagios的帐号并给定登录口令
/usr/sbin/useradd nagios
passwd nagios
在Ubuntu服务器版(6.01或更高版本),创建一个用户组名为nagios(默认是不创建的)。在Ubuntu桌面版上要跳过这一步。
/usr/sbin/groupadd nagios
/usr/sbin/usermod -G nagios nagios
创建一个用户组名为nagcmd用于从Web接口执行外部命令。将nagios用户和apache用户都加到这个组中。
/usr/sbin/groupadd nagcmd
/usr/sbin/usermod -G nagcmd nagios
/usr/sbin/usermod -G nagcmd www-data
2)下载Nagios和插件程序包
建立一个目录用以存储下载文件
mkdir ~/downloads
cd ~/downloads
下载Nagios和Nagios插件的软件包(访问http://www.nagios.org/download/站点以获得最新版本),在写本文档时,最新的Nagios的软件版本是3.0rc1,Nagios插件的版本是1.4.11。
wget http://osdn.dl.sourceforge.net/sourceforge/nagios/nagios-3.0rc1.tar.gz
wget http://osdn.dl.sourceforge.net/sourceforge/nagiosplug/nagios-plugins-1.4.11.tar.gz
3)编译与安装Nagios
展开Nagios源程序包
cd ~/downloads
tar xzf nagios-3.0rc1.tar.gz
cd nagios-3.0rc1
运行Nagios配置脚本并使用先前开设的用户及用户组:
./configure --with-command-group=nagcmd
编译Nagios程序包源码
make all
安装二进制运行程序、初始化脚本、配置文件样本并设置运行目录权限
make install
make install-init
make install-config
make install-commandmode
现在还不能启动Nagios-还有一些要做的...
4)客户化配置
样例配置文件默认安装在这个目录下/usr/local/nagios/etc,这些样例文件可以配置Nagios使之正常运行,只需要做一个简单的修改...
用你擅长的编辑器软件来编辑这个/usr/local/nagios/etc/objects/contacts.cfg配置文件,更改email地址nagiosadmin的联系人定义信息中的EMail信息为你的EMail信息以接收报警内容。
vi /usr/local/nagios/etc/objects/contacts.cfg
5)配置WEB接口
安装Nagios的WEB配置文件到Apache的conf.d目录下
make install-webconf
创建一个nagiosadmin的用户用于Nagios的WEB接口登录。记下你所设置的登录口令,一会儿你会用到它。
htpasswd -c /usr/local/nagios/etc/htpasswd.users nagiosadmin
重启Apache服务以使设置生效。
/etc/init.d/apache2 reload
6)编译并安装Nagios插件
展开Nagios插件的源程序包
cd ~/downloads
tar xzf nagios-plugins-1.4.11.tar.gz
cd nagios-plugins-1.4.11
编译并安装插件
./configure --with-nagios-user=nagios --with-nagios-group=nagios
make
make install
7)启动Nagios
把Nagios加入到服务列表中以使之在系统启动时自动启动
ln -s /etc/init.d/nagios /etc/rcS.d/S99nagios
验证Nagios的样例配置文件
/usr/local/nagios/bin/nagios -v /usr/local/nagios/etc/nagios.cfg
如果没有报错,可以启动Nagios服务
/etc/init.d/nagios start
8)登录WEB接口
你现在可以从WEB方式来接入Nagios的WEB接口了,你需要在提示下输入你的用户名(nagiosadmin)和口令,你刚刚设置的,这里用系统默认安装的浏览器,用下面这个超链接
http://localhost/nagios/
点击“服务详情”的引导超链来查看你本机的监视详情。你可能需要给点时间让Nagios来检测你机器上所依赖的服务因为检测需要些时间。
9)其他的变更
如果要接收Nagios的EMail警报,需要安装(Postfix)包
sudo apt-get install mailx
需要编辑Nagios里的EMail通知送出命令,它位于/usr/local/nagios/etc/commands.cfg文件中,将里面的'/bin/mail'全部替换为'/usr/bin/mail'。一旦设置好需要重启动Nagios以使配置生效。
sudo /etc/init.d/nagios restart
配置EMail的报警项超出了本文档的内容,指向你的系统档案用网页查找或是到这个站点NagiosCommunity.org wiki来查找更进一步的信息,以使Ubuntu系统上可以向外部地址发送EMail信息。
本文用来说明如何监控Windows主机的本地服务和特性,包括:
- 内存占用率
- CPU负载
- Disk利用率
- 服务状态
- 运行进程
- 等等
Publicly available services that are provided by Windows machines (HTTP, FTP, POP3, etc.) can be monitored easily by following the documentation on monitoring publicly available services.

Note: These instructions assume that you've installed Nagios according to the quickstart guide. The sample configuration entries below reference objects that are defined in the sample config files (commands.cfg, templates.cfg, etc.) that are installed if you follow the quickstart.
Monitoring private services or attributes of a Windows machine requires that you install an agent on it. This agent acts as a proxy between the Nagios plugin that does the monitoring and the actual service or attribute of the Windows machine. Without installing an agent on the Windows box, Nagios would be unable to monitor private services or attributes of the Windows box.
For this programlisting, we will be installing the NSClient++ addon on the Windows machine and using the check_nt plugin to communicate with the NSClient++ addon. The check_nt plugin should already be installed on the Nagios server if you followed the quickstart guide.
Other Windows agents (like NC_Net) could be used instead of NSClient++ if you wish - provided you change command and service definitions, etc. a bit. For the sake of simplicity I will only cover using the NSClient++ addon in these instructions.
There are several steps you'll need to follow in order to monitor a new Windows machine. They are:
- Perform first-time prerequisites
- Install a monitoring agent on the Windows machine
- Create new host and service definitions for monitoring the Windows machine
- Restart the Nagios daemon
To make your life a bit easier, a few configuration tasks have already been done for you:
- A check_nt command definition has been added to the commands.cfg file. This allows you to use the check_nt plugin to monitor Window services.
- A Windows server host template (called windows-server) has already been created in the templates.cfg file. This allows you to add new Windows host definitions in a simple manner.
The above-mentioned config files can be found in the /usr/local/nagios/etc/objects/ directory. You can modify the definitions in these and other definitions to suit your needs better if you'd like. However, I'd recommend waiting until you're more familiar with configuring Nagios before doing so. For the time being, just follow the directions outlined below and you'll be monitoring your Windows boxes in no time.
The first time you configure Nagios to monitor a Windows machine, you'll need to do a bit of extra work. Remember, you only need to do this for the *first* Windows machine you monitor.
Edit the main Nagios config file.
vi /usr/local/nagios/etc/nagios.cfg
Remove the leading pound (#) sign from the following line in the main configuration file:
#cfg_file=/usr/local/nagios/etc/objects/windows.cfg
Save the file and exit.
What did you just do? You told Nagios to look to the /usr/local/nagios/etc/objects/windows.cfg to find additional object definitions. That's where you'll be adding Windows host and service definitions. That configuration file already contains some sample host, hostgroup, and service definitions. For the *first* Windows machine you monitor, you can simply modify the sample host and service definitions in that file, rather than creating new ones.
Before you can begin monitoring private services and attributes of Windows machines, you'll need to install an agent on those machines. I recommend using the NSClient++ addon, which can be found at http://sourceforge.net/projects/nscplus. These instructions will take you through a basic installation of the NSClient++ addon, as well as the configuration of Nagios for monitoring the Windows machine.
1. Download the latest stable version of the NSClient++ addon from http://sourceforge.net/projects/nscplus
2. Unzip the NSClient++ files into a new C:\NSClient++ directory
3. Open a command prompt and change to the C:\NSClient++ directory
4. Register the NSClient++ system service with the following command:
nsclient++ /install
5. Install the NSClient++ systray with the following command ('SysTray' is case-sensitive):
nsclient++ SysTray
6. Open the services manager and make sure the NSClientpp service is allowed to interact with the desktop (see the 'Log On' tab of the services manager). If it isn't already allowed to interact with the desktop, check the box to allow it to.

7. Edit the NSC.INI file (located in the C:\NSClient++ directory) and make the following changes:
- Uncomment all the modules listed in the [modules] section, except for CheckWMI.dll and RemoteConfiguration.dll
- Optionally require a password for clients by changing the 'password' option in the [Settings] section.
- Uncomment the 'allowed_hosts' option in the [Settings] section. Add the IP address of the Nagios server to this line, or leave it blank to allow all hosts to connect.
- Make sure the 'port' option in the [NSClient] section is uncommented and set to '12489' (the default port).
8. Start the NSClient++ service with the following command:
nsclient++ /start
9. If installed properly, a new icon should appear in your system tray. It will be a yellow circle with a black 'M' inside.
10. Success! The Windows server can now be added to the Nagios monitoring configuration...
Now it's time to define some object definitions in your Nagios configuration files in order to monitor the new Windows machine.
Open the windows.cfg file for editing.
vi /usr/local/nagios/etc/objects/windows.cfg
Add a new host definition for the Windows machine that you're going to monitor. If this is the *first* Windows machine you're monitoring, you can simply modify the sample host definition in windows.cfg. Change the host_name, alias, and address fields to appropriate values for the Windows box.
define host{
use windows-server ; Inherit default values from a Windows server template (make sure you keep this line!)
host_name winserver
alias My Windows Server
address 192.168.1.2
}
Good. Now you can add some service definitions (to the same configuration file) in order to tell Nagios to monitor different aspects of the Windows machine. If this is the *first* Windows machine you're monitoring, you can simply modify the sample service definitions in windows.cfg.
Note: Replace "winserver" in the programlisting definitions below with the name you specified in the host_name directive of the host definition you just added.
Add the following service definition to monitor the version of the NSClient++ addon that is running on the Windows server. This is useful when it comes time to upgrade your Windows servers to a newer version of the addon, as you'll be able to tell which Windows machines still need to be upgraded to the latest version of NSClient++.
define service{
use generic-service
host_name winserver
service_description NSClient++ Version
check_command check_nt!CLIENTVERSION
}
Add the following service definition to monitor the uptime of the Windows server.
define service{
use generic-service
host_name winserver
service_description Uptime
check_command check_nt!UPTIME
}
Add the following service definition to monitor the CPU utilization on the Windows server and generate a CRITICAL alert if the 5-minute CPU load is 90% or more or a WARNING alert if the 5-minute load is 80% or greater.
define service{
use generic-service
host_name winserver
service_description CPU Load
check_command check_nt!CPULOAD!-l 5,80,90
}
Add the following service definition to monitor memory usage on the Windows server and generate a CRITICAL alert if memory usage is 90% or more or a WARNING alert if memory usage is 80% or greater.
define service{
use generic-service
host_name winserver
service_description Memory Usage
check_command check_nt!MEMUSE!-w 80 -c 90
}
Add the following service definition to monitor usage of the C:\ drive on the Windows server and generate a CRITICAL alert if disk usage is 90% or more or a WARNING alert if disk usage is 80% or greater.
define service{
use generic-service
host_name winserver
service_description C:\ Drive Space
check_command check_nt!USEDDISKSPACE!-l c -w 80 -c 90
}
Add the following service definition to monitor the W3SVC service state on the Windows machine and generate a CRITICAL alert if the service is stopped.
define service{
use generic-service
host_name winserver
service_description W3SVC
check_command check_nt!SERVICESTATE!-d SHOWALL -l W3SVC
}
Add the following service definition to monitor the Explorer.exe process on the Windows machine and generate a CRITICAL alert if the process is not running.
define service{
use generic-service
host_name winserver
service_description Explorer
check_command check_nt!PROCSTATE!-d SHOWALL -l Explorer.exe
}
That's it for now. You've added some basic services that should be monitored on the Windows box. Save the configuration file.
If you specified a password in the NSClient++ configuration file on the Windows machine, you'll need to modify the check_nt command definition to include the password. Open the commands.cfg file for editing.
vi /usr/local/nagios/etc/commands.cfg
Change the definition of the check_nt command to include the "-s <PASSWORD>" argument (where PASSWORD is the password you specified on the Windows machine) like this:
define command{
command_name check_nt
command_line $USER1$/check_nt -H $HOSTADDRESS$ -p 12489 -s PASSWORD -v $ARG1$ $ARG2$
}
Save the file.
You're done with modifying the Nagios configuration, so you'll need to verify your configuration files and restart Nagios.
If the verification process produces any errors messages, fix your configuration file before continuing. Make sure that you don't (re)start Nagios until the verification process completes without any errors!
本文档描述了如果监控Linux/UNIX的"私有"服务和属性,如:
- CPU负荷
- 内存占用率
- 磁盘利用率
- 登录用户
- 运行进程
- 等
由Linux系统上的公众服务(HTTP、FTP、SSH、SMTP等)可以按照这篇监控公众服务文档。
注意
[注意:本文档没有结束。推荐阅读文档NRPE外部构件里如何监控远程Linux/Unix服务器中的指令]
有几种不同方式来监控远程Linux/UNIX服务器的服务与属性。一个是应用共享式SSH密钥运行check_by_ssh插件来执行对远程主机的检测。这种方法本文档不讨论,但它会导致安装有Nagios的监控服务器很高的系统负荷,尤其是你要监控成百个主机中的上千个服务时,这是因为要建立/毁构SSH联接的总开销很高。
另一种方法是使用NRPE外部构件监控远程主机。NRPE外部构件可以在远程的Linux/Unix主机上执行插件程序。如果是要象监控本地主机一样对远程主机的磁盘利用率、CPU负荷和内存占用率等情况下,NRPE外部构件非常有用。
本文档将介绍如何来监控路由器和交换机的状态。一些便宜的"无网管"功能的交换机与集线器不能配置IP地址而且对于网络是不可见的组成构件,因而没办法来监控这种东西。稍贵些的交换机和路由器可以配置IP地址可以用PING检测或是通过SNMP来查询状态信息。
下面将描述如果来监控这些有网管功能的交换机、集线器和路由器:
- 包丢弃率,平均回包周期RTA
- SNMP状态信息
- 带宽与流量
监控交换机与路由器可简可繁-主要是看拥有什么样设备与想监控什么内容。做为极为重要的网络组成构件,毫无疑问至少要监控一些基本状态。
交换机与路由器可以简单地用PING来监控丢包率、RTA等数据。如果交换机支持SNMP,就可以监控端口状态等,用check_snmp插件,也可以监控带宽(如果用了MRTG),用check_mrtgtraf插件。
check_snmp插件只有当系统里安装了net-snmp和net-snmp-utils包后才编译。先确定插件已经在/usr/local/nagios/libexec目录里再继续做,如果没有这个文件,安装net-snmp和net-snmp-utils包并且重编译并重新安装Nagios插件包。
为了让工作轻松点,几个配置任务已经做好了:
- 两个命令定义(check_snmp和check_local_mrtgtraf)已经加到了commands.cfg文件中。可以用check_snmp和check_mrtgtraf插件来监控网络打印机。
- 一个交换机模板(命名为generic-switch)已经创建在templates.cfg文件里。可以在对象定义里更容易地加一个新的交换机与路由器设备。
以上的监控配置文件可以在/usr/local/nagios/etc/objects/目录里找到。如果愿意可以修改这些定义或是加入其他适合需要的更好的定义。但推荐你最好是等到你熟练地掌握了Nagios配置之后再这么做。开始的时候,只要按上述的配置来监控网络里的路由器和交换机就可以了。
要配置Nagios用于监控网络里的交换机之前,有必要做点额外工作。记住,这是首先要做的工作才能监控。
编辑Nagios的主配置文件
vi /usr/local/nagios/etc/nagios.cfg
移除文件里下面这行的最前面的(#)符号
#cfg_file=/usr/local/nagios/etc/objects/switch.cfg
保存文件并退出。
为何要这么做?这是要让Nagios检查/usr/local/nagios/etc/objects/switch.cfg配置文件来找些额外的对象定义。在文件里可以增加有关路由器和交换机设备的主机与服务定义。配置文件已经包含了几个样本主机、主机组和服务定义。做为监控路由器与交换机的第一步工作是最好在样例的主机与服务对象定义之上修改而不是重建一个。
需要做些对象定义以监控新的交换机与路由器设备。
打开switch.cfg文件进行编辑。
vi /usr/local/nagios/etc/objects/switch.cfg
给要监控的交换机加一个新的主机对象定义。如果这是第一台要监控的交换机设备,可以简单地修改switch.cfg里的样例配置。修改主机对象里的host_name、alias和address域值来适用于监控。
define host{
	use		generic-switch		; Inherit default values from a template
	host_name	linksys-srw224p		; The name we're giving to this switch
	alias		Linksys SRW224P Switch	; A longer name associated with the switch
	address		192.168.1.253		; IP address of the switch
	hostgroups	allhosts,switches	; Host groups this switch is associated with
}
现在可以加些针对监控交换机的服务对象定义(在同一个配置文件)。如果是第一台要监控的交换机设备,可以简单地修改switch.cfg里的样例配置。
注意
增加如下的服务定义以监控自Nagios监控主机到交换机的丢包率和平均回包周期RTA,在一般情况下每5分钟检测一次。
define service{
	use			generic-service	; Inherit values from a template
	host_name		linksys-srw224p	; The name of the host the service is associated with
	service_description	PING		; The service description
	check_command		check_ping!200.0,20%!600.0,60%	; The command used to monitor the service
	normal_check_interval	5	; Check the service every 5 minutes under normal conditions
	retry_check_interval	1	; Re-check the service every minute until its final/hard state is determined
}
这个服务的状态将会处于:
- 紧急(CRITICAL)-条件是RTA大于600ms或丢包率大于等于60%;
- 告警(WARNING)-条件是RTA大于200ms或是丢包率大于等于20%;
- 正常(OK)-条件是RTA小于200ms或丢包率小于20%
如果交换机与路由器支持SNMP接口,可以用check_snmp插件来监控更丰富的信息。如果不支持SNMP,跳过此节。
加入如下服务定义到你刚才修改的交换机对象定义之中
define service{
	use			generic-service	; Inherit values from a template
	host_name		linksys-srw224p
	service_description	Uptime
	check_command		check_snmp!-C public -o sysUpTime.0
}
在上述服务定义中的check_command域里,用"-C public"来指定SNMP共同体名称为"public",用"-o sysUpTime.0"指明要检测的OID(译者注-MIB节点值)。
如果要确保交换机上某个指定端口或接口的状态处于运行状态,可以在对象定义里加入一段定义:
define service{
	use			generic-service	; Inherit values from a template
	host_name		linksys-srw224p
	service_description	Port 1 Link Status
	check_command		check_snmp!-C public -o ifOperStatus.1 -r 1 -m RFC1213-MIB
}
在上例中,"-o ifOperStatus.1"指出取出交换机的端口编号为1的OID状态。"-r 1"选项是让check_snmp插件检查返回一个正常(OK)状态,如果是在SNMP查询结果中存在"1"(1说明交换机端口处于运行状态)如果没找到1就是紧急(CRITICAL)状态。"-m RFC1213-MIB"是可选的,它告诉check_snmp插件只加载"RFC1213-MIB"库而不是加载每个在系统里的MIB库,这可以加快插件运行速度。
这就是给SNMP库的例子。有成百上千种信息可以通过SNMP来监控,这完全取决于你需要做什么和如果来做监控。祝你好运!
提示

可以监控交换机或路由器的带宽利用率,用MRTG绘图并让Nagios在流量超出指定门限时报警。check_mrtgtraf插件(它已经包含在Nagios插件软件发行包中)可以实现。
需要让check_mrtgtraf插件知道如何来保存MRTG数据并存入文件,以及门限等。在例子中,监控了一个Linksys交换机。MRTG日志保存于/var/lib/mrtg/192.168.1.253_1.log文件中。这就是我用于监控的服务定义,它可以用于监控带宽数据到日志文件之中...
define service{
	use			generic-service	; Inherit values from a template
	host_name		linksys-srw224p
	service_description	Port 1 Bandwidth Usage
	check_command		check_local_mrtgtraf!/var/lib/mrtg/192.168.1.253_1.log!AVG!1000000,2000000!5000000,5000000!10
}
在上例中,"/var/lib/mrtg/192.168.1.253_1.log"参数传给check_local_mrtgtraf命令意思是插件的MRTG日志文件在这个文件里读写,"AVG"参数的意思是取带宽的统计平均值,"1000000,200000"参数是指流入的告警门限(以字节为单位),"5000000,5000000"是输出流量紧急状态门限(以字节为单位),"10"是指如果MRTG日志如果超过10分钟没有数据返回一个紧急状态(应该每5分钟更新一次)。
保存该配置文件
一旦给switch.cfg文件里加好新的主机与服务对象定义,就可以开始对路由器与交换机进行监控。为了开始监控,需要先验证配置文件再重新启动Nagios。
如果验证过程有有任何错误信息,修改配置文件再继续。一定要保证配置验证过程中没有错误信息再启动Nagios!
本文件描述了如何监控网络打印机。特别是有内置或外置JetDirect卡的HP惠普打印机设备,或是其他(象Troy PocketPro 100S或Netgear PS101)支持JetDirect协议的打印机。
check_hpjd插件(该命令是Nagios插件软件发行包的标准组成部分)可以用SNMP使能的方式来监控JetDirect兼容型打印机。该插件可以检查如下打印机状态:
- 卡纸
- 无纸
- 打印机离线
- 需要人工干预
- 墨盒墨粉低
- 内存不足
- 开外壳
- 输出托盘已满
- 和其他...
监控网络打印机的状态很简单。有JetDirect功能的打印机一般提供SNMP功能,可以用check_hpjd插件来检测状态。
check_hpjd插件只是当当前系统中安装有net-snmp和net-snmp-utils软件包时才会被编译和安装。要保证在/usr/local/nagios/libexec目录下有check_hpjd文件再继承,否则,要安装好net-snmp和net-snmp-utils软件包再重新编译安装Nagios插件包。
为使这项工作更轻松,几个配置工作已经做好:
- check_hpjd的命令定义已经加到了commands.cfg配置文件中,可以用check_hpjd插件来监控网络打印机;
- 一个网络打印机模板(命名为generic-printer)已经在templates.cfg配置文件里创建好,可以更方便地加入一个新打印机设备的主机对象。
上面的监控配置文件可以在/usr/local/nagios/etc/objects/目录里找到。如果想做,可以修改里面的定义以更好地适用于你的情况。但是在此之前,推荐你要熟悉Nagios的配置之后再做。起初,最好只是按下面的大概修改一下以实现对网络打印机的监控。
在配置Nagios用于监控网络打印机之前,有些额外工作,记住这是要对第一台打印机设备进行监控。
编辑Nagios的主配置文件。
vi /usr/local/nagios/etc/nagios.cfg
移除下面这行最前面的(#)号:
#cfg_file=/usr/local/nagios/etc/objects/printer.cfg
保存文件并退出编辑。
为何要这样?告诉Nagios查找/usr/local/nagios/etc/objects/printer.cfg文件以取得额外对象定义。该文件中将加入网络打印机设备的主机与服务对象定义。这个配置文件里已经包含有一个样本主机、主机组和服务定义。给第一台打印机设备做监控,可以简单地修改这个文件而不需重生成一个。
需要创建几个对象定义以进行网络打印机的监控。
打开printer.cfg文件并编辑它。
vi /usr/local/nagios/etc/objects/printer.cfg
增加一个你要监控的网络打印机设备的主机对象定义。如果这是第一台打印机设备,可以简单地修改printer.cfg文件里的样本主机定义。将合理的值赋在host_name、alias和address域里。
define host{
	use		generic-printer	; Inherit default values from a template
	host_name	hplj2605dn	; The name we're giving to this printer
	alias		HP LaserJet 2605dn	; A longer name associated with the printer
	address		192.168.1.30	; IP address of the printer
	hostgroups	allhosts	; Host groups this printer is associated with
}
现在可以给监控的打印机加些服务定义(在同一个配置文件里)。如果是第一台被监控的网络打印机,可以简单地修改printer.cfg里的服务配置。
注意
按如下方式加好对打印机状态检测的服务定义。服务用check_hpjd插件来检测打印机状态,默认情况下每10分钟检测一次。SNMP共同体串是"public"。
define service{
	use			generic-service		; Inherit values from a template
	host_name		hplj2605dn		; The name of the host the service is associated with
	service_description	Printer Status		; The service description
	check_command		check_hpjd!-C public	; The command used to monitor the service
	normal_check_interval	10	; Check the service every 10 minutes under normal conditions
	retry_check_interval	1	; Re-check the service every minute until its final/hard state is determined
}
加入一个默认每10分钟进行一次的PING检测服务。用于检测RTA、丢包率和网络联接状态。
define service{
        use                     generic-service
        host_name               hplj2605dn
        service_description     PING
        check_command           check_ping!3000.0,80%!5000.0,100%
        normal_check_interval   10
        retry_check_interval    1
}
保存配置文件。
本文档描述了如何对Netware服务器的"私有"服务和属性进行监控,象这些:
- 内存占用率
- 处理器利用率
- 缓冲区使用情况
- 活动的联接
- 磁盘卷使用率
- 等
由Netware服务器提供的公众服务(HTTP、FTP等)的监控可以按文档监控公众服务来做。
TODO...
Novell有一些有关Nagios如何来做Netware监控的文档,在网站的Cool Solutions栏目里,包括:
This document describes how you can monitor publicly available services, applications and protocols. By "public" I mean services that are accessible across the network - either the local network or the greater Internet. Examples of public services include HTTP, POP3, IMAP, FTP, and SSH. There are many more public services that you probably use on a daily basis. These services and applications, as well as their underlying protocols, can usually be monitored by Nagios without any special access requirements.
Private services, in contrast, cannot be monitored with Nagios without an intermediary agent of some kind. Examples of private services associated with hosts are things like CPU load, memory usage, disk usage, current user count, process information, etc. These private services or attributes of hosts are not usually exposed to external clients. This situation requires that an intermediary monitoring agent be installed on any host that you need to monitor such information on. More information on monitoring private services on different types of hosts can be found in the documentation on:
Tip: Occassionally you will find that information on private services and applications can be monitored with SNMP. The SNMP agent allows you to remotely monitor otherwise private (and inaccessible) information about the host. For more information about monitoring services using SNMP, check out the documentation on monitoring switches and routers.
Note: These instructions assume that you've installed Nagios according to the quickstart guide. The sample configuration entries below reference objects that are defined in the sample commands.cfg and localhost.cfg config files.
When you find yourself needing to monitor a particular application, service, or protocol, chances are good that a plugin exists to monitor it. The official Nagios plugins distribution comes with plugins that can be used to monitor a variety of services and protocols. There are also a large number of contributed plugins that can be found in the contrib/ subdirectory of the plugin distribution. The NagiosExchange.org website hosts a number of additional plugins that have been written by users, so check it out when you have a chance.
If you don't happen to find an appropriate plugin for monitoring what you need, you can always write your own. Plugins are easy to write, so don't let this thought scare you off. Read the documentation on developing plugins for more information.
I'll walk you through monitoring some basic services that you'll probably use sooner or later. Each of these services can be monitored using one of the plugins that gets installed as part of the Nagios plugins distribution. Let's get started...
Before you can monitor a service, you first need to define a host that is associated with the service. You can place host definitions in any object configuration file specified by a cfg_file directive or placed in a directory specified by a cfg_dir directive. If you have already created a host definition, you can skip this step.
For this programlisting, lets say you want to monitor a variety of services on a remote host. Let's call that host remotehost. The host definition can be placed in its own file or added to an already exiting object configuration file. Here's what the host definition for remotehost might look like:
define host{
use generic-host ; Inherit default values from a template
host_name remotehost ; The name we're giving to this host
alias Some Remote Host ; A longer name associated with the host
address 192.168.1.50 ; IP address of the host
hostgroups allhosts ; Host groups this host is associated with
}
Now that a definition has been added for the host that will be monitored, we can start defining services that should be monitored. As with host definitions, service definitions can be placed in any object configuration file.
For each service you want to monitor, you need to define a service in Nagios that is associated with the host definition you just created. You can place service definitions in any object configuration file specified by a cfg_file directive or placed in a directory specified by a cfg_dir directive.
Some programlisting service definitions for monitoring common public service (HTTP, FTP, etc) are given below.
Chances are you're going to want to monitor web servers at some point - either yours or someone else's. The check_http plugin is designed to do just that. It understands the HTTP protocol and can monitor response time, error codes, strings in the returned HTML, server certificates, and much more.
The commands.cfg file contains a command definition for using the check_http plugin. It looks like this:
define command{
name check_http
command_name check_http
command_line $USER1$/check_http -I $HOSTADDRESS$ $ARG1$
}
A simple service definition for monitoring the HTTP service on the remotehost machine might look like this:
define service{
use generic-service ; Inherit default values from a template
host_name remotehost
service_description HTTP
check_command check_http
}
This simple service definition will monitor the HTTP service running on remotehost. It will produce alerts if the web server doesn't respond within 10 seconds or if it returns HTTP errors codes (403, 404, etc.). That's all you need for basic monitoring. Pretty simple, huh?
Tip: For more advanced monitoring, run the check_http plugin manually with --help as a command-line argument to see all the options you can give the plugin. This --help syntax works with all of the plugins I'll cover in this document.
A more advanced definition for monitoring the HTTP service is shown below. This service definition will check to see if the /download/index.php URI contains the string "latest-version.tar.gz". It will produce an error if the string isn't found, the URI isn't valid, or the web server takes longer than 5 seconds to respond.
define service{
use generic-service ; Inherit default values from a template
host_name remotehost
service_description Product Download Link
check_command check_http!-u /download/index.php -t 5 -s "latest-version.tar.gz"
}
When you need to monitor FTP servers, you can use the check_ftp plugin. The commands.cfg file contains a command definition for using the check_ftp plugin, which looks like this:
define command{
command_name check_ftp
command_line $USER1$/check_ftp -H $HOSTADDRESS$ $ARG1$
}
A simple service definition for monitoring the FTP server on remotehost would look like this:
define service{
use generic-service ; Inherit default values from a template
host_name remotehost
service_description FTP
check_command check_ftp
}
This service definition will monitor the FTP service and generate alerts if the FTP server doesn't respond within 10 seconds.
A more advanced service definition is shown below. This service will check the FTP server running on port 1023 on remotehost. It will generate an alert if the server doesn't respond within 5 seconds or if the server response doesn't contain the string "Pure-FTPd [TLS]".
define service{
use generic-service ; Inherit default values from a template
host_name remotehost
service_description Special FTP
check_command check_ftp!-p 1023 -t 5 -e "Pure-FTPd [TLS]"
}
When you need to monitor SSH servers, you can use the check_ssh plugin. The commands.cfg file contains a command definition for using the check_ssh plugin, which looks like this:
define command{
command_name check_ssh
command_line $USER1$/check_ssh $ARG1$ $HOSTADDRESS$
}
A simple service definition for monitoring the SSH server on remotehost would look like this:
define service{
use generic-service ; Inherit default values from a template
host_name remotehost
service_description SSH
check_command check_ssh
}
This service definition will monitor the SSH service and generate alerts if the SSH server doesn't respond within 10 seconds.
A more advanced service definition is shown below. This service will check the SSH server and generate an alert if the server doesn't respond within 5 seconds or if the server version string string doesn't match "OpenSSH_4.2".
define service{
use generic-service ; Inherit default values from a template
host_name remotehost
service_description SSH Version Check
check_command check_ssh!-t 5 -r "OpenSSH_4.2"
}
The check_smtp plugin can be using for monitoring your email servers. The commands.cfg file contains a command definition for using the check_smtp plugin, which looks like this:
define command{
command_name check_smtp
command_line $USER1$/check_smtp -H $HOSTADDRESS$ $ARG1$
}
A simple service definition for monitoring the SMTP server on remotehost would look like this:
define service{
use generic-service ; Inherit default values from a template
host_name remotehost
service_description SMTP
check_command check_smtp
}
This service definition will monitor the SMTP service and generate alerts if the SMTP server doesn't respond within 10 seconds.
A more advanced service definition is shown below. This service will check the SMTP server and generate an alert if the server doesn't respond within 5 seconds or if the response from the server doesn't contain "mygreatmailserver.com".
define service{
use generic-service ; Inherit default values from a template
host_name remotehost
service_description SMTP Response Check
check_command check_smtp!-t 5 -e "mygreatmailserver.com"
}
The check_pop plugin can be using for monitoring the POP3 service on your email servers. The commands.cfg file contains a command definition for using the check_pop plugin, which looks like this:
define command{
command_name check_pop
command_line $USER1$/check_pop -H $HOSTADDRESS$ $ARG1$
}
A simple service definition for monitoring the POP3 service on remotehost would look like this:
define service{
use generic-service ; Inherit default values from a template
host_name remotehost
service_description POP3
check_command check_pop
}
This service definition will monitor the POP3 service and generate alerts if the POP3 server doesn't respond within 10 seconds.
A more advanced service definition is shown below. This service will check the POP3 service and generate an alert if the server doesn't respond within 5 seconds or if the response from the server doesn't contain "mygreatmailserver.com".
define service{
use generic-service ; Inherit default values from a template
host_name remotehost
service_description POP3 Response Check
check_command check_pop!-t 5 -e "mygreatmailserver.com"
}
The check_imap plugin can be using for monitoring IMAP4 service on your email servers. The commands.cfg file contains a command definition for using the check_imap plugin, which looks like this:
define command{
command_name check_imap
command_line $USER1$/check_imap -H $HOSTADDRESS$ $ARG1$
}
A simple service definition for monitoring the IMAP4 service on remotehost would look like this:
define service{
use generic-service ; Inherit default values from a template
host_name remotehost
service_description IMAP
check_command check_imap
}
This service definition will monitor the IMAP4 service and generate alerts if the IMAP server doesn't respond within 10 seconds.
A more advanced service definition is shown below. This service will check the IAMP4 service and generate an alert if the server doesn't respond within 5 seconds or if the response from the server doesn't contain "mygreatmailserver.com".
define service{
use generic-service ; Inherit default values from a template
host_name remotehost
service_description IMAP4 Response Check
check_command check_imap!-t 5 -e "mygreatmailserver.com"
}
Once you've added the new host and service definitions to your object configuration file(s), you're ready to start monitoring them. To do this, you'll need to verify your configuration and restart Nagios.
If the verification process produces any errors messages, fix your configuration file before continuing. Make sure that you don't (re)start Nagios until the verification process completes without any errors!
在你开始监控网络与系统之前要有同个不同配置文件需要创建和编辑。耐心点,配置Nagios可能是要花些时间特别是对于那些初次使用者。弄清其机理所有的将它们搞定绝对是值得的。 :-)
主配置文件包括了一系列的设置,它们会影响Nagios守护进程。不仅是Nagios守护进程要使用主配置文件,CGIs程序组模块也需要,因此,主配置文件是你开始学习配置其他文件的基础。
有关主配置文件的文档在这里。
资源文件可以保存用户自定义的宏。资源文件的一个主要用处是用于保存一些敏感的配置信息如系统口令等不能让CGIs程序模块获取到的东西。
你可以在主配置文件中设置resource_file指向一个或是多个资源文件。
注意
当创建或编辑配置文件时,要遵守如下要求:
- 以符号'#'开头的行将视为注释不做处理;
- 变量必须是新起的一行 - 变量之前不能有空格符;
- 变量名是大小写敏感的;
主配置文件一般(实际是固定的)是nagios.cfg,存放位置在/usr/local/nagios/etc/目录里(--如果是rpm包来安装,应该是在/etc/nagios/)。
下面将对每个主配置文件里的选项进行说明...
这个变量用于设定Nagios在何处创建其日志文件。它应该是你主配置文件里面的第一个变量,当Nagios找到你配置文件并发现配置里有错误时会向该文件中写入错误信息。如果你使能了日志回滚,Nagios将在每小时、每天、每周或每月对日志进行回滚。
表 5.2. 对象配置文件
| 格式: | cfg_file=<file_name> |
| 样例: | cfg_file=/usr/local/nagios/etc/hosts.cfg cfg_file=/usr/local/nagios/etc/services.cfg cfg_file=/usr/local/nagios/etc/commands.cfg |
该变量用于指定一个包含有将用于Nagios监控对象的对象配置文件。对象配置文件中包括有主机、主机组、联系人、联系人组、服务、命令等等对象的定义。配置信息可以切分为多个文件并且用cfg_file=语句来指向每个待处理的配置文件。
表 5.3. 对象配置目录
| 格式: | cfg_dir=<directory_name> |
| 样例: | cfg_dir=/usr/local/nagios/etc/commands cfg_dir=/usr/local/nagios/etc/services cfg_dir=/usr/local/nagios/etc/hosts |
该变量用于指定一个目录,目录里包含有将用于Nagios监控对象的对象配置文件。所有的在这个目录下的且以.cfg为扩展名的文件将被作为配置文件来处理。另外,Nagios将会递归该目录下的子目录并处理其子目录下的全部配置文件。你可以把配置放入不同的目录并且用cfg_dir=语句来指向每个待处理的目录。
表 5.4. 对象缓冲文件
| 格式: | object_cache_file=<file_name> |
| 样例: | object_cache_file=/usr/local/nagios/var/objects.cache |
该变量用于指定一个用于缓冲对象定义复本的文件存放位置。对象缓冲将在每次Nagios的启动和重启时和使用CGI模块时被创建或重建。它试图加快在CGI里的配置缓冲并使得你在编辑对象配置文件时可以让正在运行的Nagios不影响CGI的显示输出。
表 5.5. 预缓冲对象文件
| 格式: | precached_object_file=<file_name> |
| 样例: | precached_object_file=/usr/local/nagios/var/objects.precache |
该变量用于指定一个用于指定一个用于预处理、预缓冲 This directive is used to specify a file in which a pre-processed, pre-cached copy of 对象定义复本的文件存放位置。在大型或复杂Nagios安装模式下这个文件可用于显著地减少Nagios的启动时间。如何加快启动的更多信息可以查看这个内容。
该变量用于指定一个可选的包含有$USERn$宏定义的可选资源文件。$USERn$宏在存放用户名、口令及通用的命令定义内容(如目录路径)时非常有用。CGIs模块将不会试图读取资源文件,所以你可以限定这权文件权限(600或660)来保护敏感信息。你可以在主配置文件里用resource_file语句来加入多个资源文件-Nagios将会处理它们。如何定义$USERn$宏参见样例resource.cfg文件,它放在Nagios发行包的sample-config/子目录下。
该变量用于指定一个临时文件,Nagios将在更新注释数据、状态数据等时周期性地创建它。该文件不再需要时会删除它。
这个变量是一个目录,该目录是块飞地,在监控过程中用于创建临时文件。你应在该目录内运行tmpwatch或类似的工具程序以删除早于24小时的文件(这是个垃圾文件存放地)。
这个变量指向一个文件,文件被Nagios用于保存当前状态、注释和宕机信息。CGI模块也会用这个文件以通过Web接口来显示当前被监控的状态,CGI模块必须要有这个文件的读取权限以使工作正常。在Nagios停机或在重启动时将会删除并重建该文件。
这个变量设置了Nagios更新状态文件的速度(秒为单位),最小更新间隔是1秒。
该变量指定了Nagios进程使用哪个用户运行。当程序启动完成并开始监控对象之前,Nagios将切换自己的权限并使用该用户权限运行。你可以指定用户或是UID名。
该变量用于指定Nagios使用哪个用户组运行。当程序启动完成并开始监控对象之前,Nagios将切换自己的权限并以该用户组权限运行。你可以拽定用户组或GID名。
该选项决定了Nagios在初始化启动或重启动时是否要送出通知。如果这个选项不使能,Nagios将不会向任何主机或服务送出通知。注意,如果你打开了状态保持选项,Nagios在其启动和重启时将忽略此设置并用这个选项的最近的一个设置(已经保存在状态保持文件)的值来工作,除非你取消了use_retained_program_state选项。如果你想在使能状态保存选项(并且是use_retained_program_state使能)的情况下更改这个选项,你必须要通过合适的外部命令或是通过Web接口来修改它。选项的取值可以是:
- 0 = 关闭通知
- 1 = 打开通知(默认)
这个选项指定了Nagios在初始的启动或重启时是否要执行服务检测。如果这个没有使能,Nagios将不会主动地执行任何服务的检测并且保持一系列的"静默"状态(它仍旧可以接收被动检测除非你已经将accept_passive_service_checks选项关闭)。这个选项经常用于备份被监控服务配置,被监控服务的配置备份在文档冗余安装或设置成一个分布式监控环境中有描述。注意:如果你已经使能了状态保持,Nagios在其启动或重启时将会忽略这个选项设置并使用和旧的设置值(旧值保存于状态保持文件),除非你关闭了use_retained_program_state选项。如果你想在状态保持使能(和use_retained_program_state选项使能)的情况下修改这个选项,你只得用适当的外部命令或是通过Web接口来修改它。选项可用的值有:
- 0 = 不执行服务检测
- 1 = 执行服务检测(默认)
该选项决定了Nagios在其初始化启动或重启后是否要授受强制服务检测,如果它关闭了,Nagios将不会接受任何强制服务检测结果。注意:如果你已经使能了状态保持,Nagios在其启动或重启时将会忽略这个选项设置并使用和旧的设置值(旧值保存于状态保持文件),除非你关闭了use_retained_program_state选项。如果你想在状态保持使能(和use_retained_program_state选项使能)的情况下修改这个选项,你只得用适当的外部命令或是通过Web接口来修改它。选项可用的值有:
- 0 = 不接受强制服务检测结果
- 1 = 接受强制服务检测结果(默认)
该选项将决定Nagios在初始地启动或重启时是否执行按需地和有规律规划检测。如果该选项不使能,那么Nagios将不会对任何主机进行检测,然而它仍旧可以接收强制主机检测结果除非你已经将accept_passive_host_checks选项关闭。该选项通常用于监控服务器的配置备份,详细信息请查看冗余安装的配置,或是用于设置一个分布式监控环境中。注意:如果你已经使能retain_state_information状态保持选项,Nagios将在启动和重启时使用旧的选项值(保存于state_retention_file状态保持文件中)而忽略此设置,除非你关闭了use_retained_program_state选项。如果你想在保持选项使能(且use_retained_program_state选项使能)的情况下修改这个选项,你只得用适当的外部命令或是通过Web接口来修改它。选项可用的值有:
- 0 = 不执行主机检测
- 1 = 执行主机检测(默认)
该选项决定了在Nagios初始启动或重启后是否要接受强制主机检测结果。如果这个选项关闭,Nagios将不再接受任何强制主机检测结果。注意:如果你使能retain_state_information状态保持选项,Nagios将在启动或重启动时使用旧的选项设置(保存于state_retention_file状态保持文件中)而忽略这个设置。除非你已经关闭use_retained_program_state选项。如果你想在保持选项使能(且use_retained_program_state选项使能)的情况下修改这个选项,你只得用适当的外部命令或是通过Web接口来修改它。选项可用的值有:
- 0 = 不接受强制主机检测结果
- 1 = 接受强制主机检测结果(默认)
该选项决定了在Nagios初始启动或重启后是否要运行事件处理,如果该选项关闭,Nagios将不做任何主机或服务的事件处理。注意:如果你使能retain_state_information状态保持选项(保存于state_retention_file状态保持文件中)而忽略这个设置,除非你已经关闭use_retained_program_state选项。如果你想在保持选项使能(且use_retained_program_state选项使能)的情况下修改这个选项,你只得用适当的外部命令或是通过Web接口来修改它。选项可用的值有:
- 0 = 禁止事件处理
- 1 = 打开事件处理(默认)
该选项决定了你想让Nagios以何种方法回滚你的日志文件。可用的值有:
- n = None (不做日志回滚 - 这个是默认值)
- h = Hourly (每小时做一次日志回滚)
- d = Daily (每天午夜做日志回滚)
- w = Weekly (每周六午夜做日志回滚)
- m = Monthly (每月最后一天的午夜做日志回滚)
该选项将指定一个用于存放回滚日志文件的保存路径。如果没有使用日志回滚功能时会忽略此设置。
该选项决定了Nagios是否要检查存于命令文件里的将要执行的命令。这个选项在你计划通过Web接口来运行CGI命令时必须要打开它。更多的关于外部命令的信息可以查阅这份文档。
- 0 = 不做外部命令检测
- 1 = 检测外部命令(默认值)
如果你指定了一个数字加一个"s"(如30s),那么外部检测命令的间隔是这个数值以秒为单位的时间间隔。如果没有用"s",那么外部检测命令的间隔是以这个数值的“时间单位”的时间间隔,除非你把interval_length的值(下面有说明)从默认60给更改了,这个值的意思是60s,即一分钟。
注意:将这个值设置为-1可令Nagios尽可能频繁地对外命令进行检测。在进行其他任务之前,Nagios每次都将会读入并处理保存于命令文件之中的全部命令以进行命令检查。更多的关于外部命令的信息可以查阅这份文档。
这是一个Nagios用于外部命令检测处理的文件,命令CGI程序模块将命令写入该文件,外部命令文件实现成一个命名管道(先入先出),在Nagios启动时创建它,并在关闭时删除它。如果在Nagios启动时该文件已经存在,那么Nagios会给出一个错误信息后中止。更多的关于外部命令的信息可以查阅这份文档。
注意:这是个高级特性。该选项决定了Nagios将使用多少缓冲队列来缓存外部命令,外部命令是从一个工作线程从外部命令文件将命令读入的,但这些外部命令还没有被Nagios的主守护程序处理。缓冲中的每个位置可以处理一个外部命令,所以这个选项决定了有多少命令可以被缓冲处理。为了对一个有大量被动检测系统(比如分布式系统安装)进行安装时,你可能需要降低这个值。你要考虑使用MRTG工具来绘制外部命令缓冲的利用率图表,如何配置绘制图表可阅读这篇文档。
该选项指定了Nagios在以守护态运行(以-d命令行参数运行)时在哪个位置上创建互锁文件。该文件包含有运行Nagios的进程id值(PID)。
该选项决定了Nagios是否要在程序的两次启动之间保存主机和服务的状态信息。如果你使能了这个选项,你应预先给出了state_retention_file变量的值,当选项使能时,Nagios将会在程序停止(或重启)时保存全部的主机和服务的状态信息并且会在启动时再次预读入保存的状态信息。
- 0 = 不保存状态保持信息
- 1 = 保留状态保持信息(默认)
表 5.27. 状态保持文件
| 格式: | state_retention_file=<file_name> |
| 样例: | state_retention_file=/usr/local/nagios/var/retention.dat |
该文件用于在Nagios停止之前保存状态、停机时间和注释等信息。当Nagios重启时它会在开始监控工作之前使用保存于这个文件里的信息用于初始化主机与服务的状态。为使Nagios在程序的启动之间利用状态保持信息,你必须使能retain_state_information选项。
该选项决定了Nagios需要以什么频度(分钟为单位)在正常操作时自动地保存状态保持信息。如果你把这个值设置为0,Nagios将不会以规则的间隔保存状态保持数据,但是Nagios仍旧会在停机或重启之前做保存状态保持数据的工作。如果你关闭了状态保持功能(用retain_state_information选项设置),这个选项值将无效。
这个设置将决定了Nagios是否要使用保存于状态保持文件之中的值以更新程序范围内的变量状态。有些程序范围内的变量的状态将在程序重启时被保存于状态保持文件之中,包括enable_notifications、enable_flap_detection、enable_event_handlers、execute_service_checks和accept_passive_service_checks选项。如果你没有使用retain_state_information状态保持选项使能,这个选项将无效。
- 0 = 不使用程序变量的状态值
- 1 = 使用状态保持文件中的程序变量状态记录(默认)
该选项决定Nagios在重启时是否要使用主机和服务的保持计划表信息(下次检测时间)。如果增加了很多数量(或很大百分比)的主机和服务,建议你在首次重启动Nagios时关闭选项,因为这个选项将会使初始检测误入歧途。其他情况下你可以要使能这个选项。
- 0 = 不使用计划表信息
- 1 = 使用保存的计划表信息(默认)
表 5.31. 保持主机和服务属性掩码
| 格式: | retained_host_attribute_mask=<number> retained_service_attribute_mask=<number> |
| 样例: | retained_host_attribute_mask=0 retained_service_attribute_mask=0 |
警告:这是个高级特性。你需要读一下源程序以看清楚它是如何起效果的。
该选项决定了哪个主机和服务的属性在程序重启时不会被保留。这些选项值是与指定的"MODATTR_"值进行按位与运算出的,MODATTR_在源程序的include/common.h里定义,默认情况下,全部主机和服务的属性都会被保持。
表 5.32. 保持进程属性掩码
| 格式: | retained_process_host_attribute_mask=<number> retained_process_service_attribute_mask=<number> |
| 样例: | retained_process_host_attribute_mask=0 retained_process_service_attribute_mask=0 |
警告:这是个高级特性。你需要读一下源程序以看清楚它是如何起效果的。
该选项决定了哪个进程属性在程序重启时不会被保留。有两个属性掩码因为经常是主机和服务的进程属性可以分别被修改。例如,主机检测在程序层面上被关闭,而服务检测仍旧被打开。这些选项值是与指定的"MODATTR_"值进行按位与运算出的,MODATTR_在源程序的include/common.h里定义,默认情况下,全部主机和服务的属性都会被保持。
表 5.33. 保持联系人属性掩码
| 格式: | retained_contact_host_attribute_mask=<number> retained_contact_service_attribute_mask=<number> |
| 样例: | retained_contact_host_attribute_mask=0 retained_contact_service_attribute_mask=0 |
警告:这是个高级特性。你需要读一下源程序以看清楚它是如何起效果的。
该选项决定了哪个联系人属性在程序重启时不会被保留。有两个属性掩码因为经常是主机和服务的联系人属性可以分别被修改。这些选项值是与指定的"MODATTR_"值进行按位与运算出的,MODATTR_在源程序的include/common.h里定义,默认情况下,全部主机和服务的属性都会被保持。
该选项决定了是否将日志信息记录到本地的Syslog中。可用的值有:
- 0 = 不使用Syslog机制
- 1 = 使用Syslog机制
该选项决定了是否将通知信息记录进行记录,如果有很多联系人或是有规律性的服务故障时,记录文件将会增长很快。使用这个选项来保存已发出的通知记录。
- 0 = 不记录通知
- 1 = 记录通知
该选项决定了是否将服务检测重试进行记录。服务检测重试发生在服务检测结果返回一个异常状态信息之时,而且你已经配置Nagios在对故障出现时进行一次以上的服务检测重试。此时有服务状态被认为是处理“软”故障状态。当调试Nagios或对服务的事件处理进行测试时记录下服务检测的重试是非常有用的。
- 0 = 不记录服务检测重试
- 1 = 记录服务检测重试
该选项决定了是否将主机检测重试进行记录。当调试Nagios或对主机的事件处理进行测试时记录下主机检测的重试是非常有用的。
- 0 = 不记录主机检测重试
- 1 = 记录主机检测重试
该选项决定了是否将服务和主机的事件处理进行记录。一旦发生服务或主机状态迁移时,可选的事件处理命令会被执行。当调试Nagios或首次尝试事件处理脚本时记录下事件处理是非常有用的。
- 0 = 不记录事件处理
- 1 = 记录事件处理
该选项决定了Nagios是否要强行记录全部的主机和服务的初始状态,即便状态报告是OK也要记录。只是在第一次检测发现主机和服务有异常时才会记录下初始状态。如果想用应用程序扫描一段时间内的主机和服务状态以生成统计报告时,使能这个选项将有很有帮助。
- 0 = 不记录初始状态(默认)
- 1 = 记录初始状态
该选项决定了Nagios是否要记录外部命令,外部命令是从command_file外部命令文件中提取的。注意:这个选项并不控制是否要对强制服务检测 (一种外部命令类型)进行记录。为使能或关闭对强制服务检测的记录,使用log_passive_checks强制检测记录选项。
- 0 = 不记录外部命令
- 1 = 记录外部命令(默认)
该选项决定了Nagios是否要记录来自于command_file外部命令文件的强制主机和强制服务检测命令。如果要设置一个分布式监控环境或是计划在规整的基础上要对大量的强制检测的结果进行处理时,需要关闭这个选项以防止日志文件过份增长。
- 0 = 不记录强制检测
- 1 = 记录强制检测(默认)
表 5.42. 全局主机事件处理选项
| 格式: | global_host_event_handler=<command> |
| 样例: | global_host_event_handler=log-host-event-to-db |
该选项指定了当每个主机状态迁移时需要执行的主机事件处理命令。全局事件处理命令将优于在每个主机定义的事件处理命令而立即执行。命令参数是在对象配置文件里定义的命令的短名称。由event_handler_timeout事件处理超时选项控制的这个命令可运行的最大次数。更多的有关事件处理的信息可以查阅这篇文档。
表 5.43. 全局服务事件处理选项
| 格式: | global_service_event_handler=<command> |
| 样例: | global_service_event_handler=log-service-event-to-db |
该选项指定了当每个服务状态迁移时需要执行的服务事件处理命令。全局事件处理命令将优于在每个服务定义的事件处理命令而立即执行。命令参数是在对象配置文件里定义的命令的短名称。由event_handler_timeout事件处理超时选项控制的这个命令可运行的最大次数。更多的有关事件处理的信息可以查阅这篇文档。
它指定了Nagios在进行计划表的下一次服务或主机检测命令执行之前应该休止多少秒。注意Nagios只是在已经进行了服务故障的排队检测之后才会休止。
表 5.45. 服务检测迟滞间隔计数方法
| 格式: | service_inter_check_delay_method=<n/d/s/x.xx> |
| 样例: | service_inter_check_delay_method=s |
该选项容许你控制服务检测将如何初始展开事件队列。 Using a "smart" delay calculation (the default) will cause Nagios to calculate an average check interval and spread initial checks of all services out over that interval, thereby helping to eliminate CPU load spikes. Using no delay is generally not recommended, as it will cause all service checks to be scheduled for execution at the same time. This means that you will generally have large CPU spikes when the services are all executed in parallel. More information on how to estimate how the inter-check delay affects service check scheduling can be found here. Values are as follows:
- n = Don't use any delay - schedule all service checks to run immediately (i.e. at the same time!)
- d = Use a "dumb" delay of 1 second between service checks
- s = Use a "smart" delay calculation to spread service checks out evenly (default)
- x.xx = Use a user-supplied inter-check delay of x.xx seconds
This option determines the maximum number of minutes from when Nagios starts that all services (that are scheduled to be regularly checked) are checked. This option will automatically adjust the service_inter_check_delay_methodservice inter-check delay method (if necessary) to ensure that the initial checks of all services occur within the timeframe you specify. In general, this option will not have an affect on service check scheduling if scheduling information is being retained using the use_retained_scheduling_infouse_retained_scheduling_info option. 默认值是30分钟。
This variable determines how service checks are interleaved. Interleaving allows for a more even distribution of service checks, reduced load on remote hosts, and faster overall detection of host problems. Setting this value to 1 is equivalent to not interleaving the service checks (this is how versions of Nagios previous to 0.0.5 worked). Set this value to s (smart) for automatic calculation of the interleave factor unless you have a specific reason to change it. The best way to understand how interleaving works is to watch the status CGI (detailed view) when Nagios is just starting. You should see that the service check results are spread out as they begin to appear. More information on how interleaving works can be found here.
- x = A number greater than or equal to 1 that specifies the interleave factor to use. An interleave factor of 1 is equivalent to not interleaving the service checks.
- s = Use a "smart" interleave factor calculation (default)
该选项可指定在任意给定时间里可被同时运行的服务检测命令的最大数量。如果指定这个值为1,则说明不允许任何并行服务检测,如果指定为0(默认值)则是对并行服务检测。你须按照可运行Nagios的机器上的机器资源情况修改这个值,因为它会直接影响系统最大负荷,它施加于系统(处理器利用率、内存使用率等)之上。更多的关于如何评估需要设置多少并行检测值的信息可以查阅这篇文档。
表 5.49. 检测结果的回收频度
| 格式: | check_result_reaper_frequency=<frequency_in_seconds> |
| 样例: | check_result_reaper_frequency=5 |
该选项控制检测结果的回收事件的处理频度(以秒为单位)。从主机和服务的检测过程里“回收”事件处理结果将是对已经执行结束的检测。事件的构成在Nagios里是监控逻辑里的核心内容。
该选项决定主机和服务检测结果回收时对结果回收时间段的控制,这个值是个以秒为单位的最大时间跨度。从主机和服务的检测过程里“回收”事件处理结果将是对已经执行结束的检测。如果有许多结果要处理,回收事件过程将占用很长时间来完成它,这将延迟对新的主机和服务检测的执行。该选项可以限制从检测结果得到与回收处理之间的最大时间间隔以使Nagios可以完成对其他监控逻辑的转换处理。
该选项决定了Nagios将在处理检测结果之前使用哪个目录来保存主机和服务检测结果。这个目录不能保存其他文件,因为Nagios会周期性地清理这个目录下的旧文件(更多信息见max_check_result_file_age选项)。
注意:确保只有一个Nagios的实例在操作检测结果保存路径。如果有多个Nagios的实例来操作相同的目录,将会因为错误的Nagios实例不正确地处理导致有错误结果!
该选项决定用最大多少秒来限定那些在check_result_path设置所指向目录里的检测结果文件是合法的。如果检测结果文件超出了这个门限,Nagios将会把过旧的文件删除而且不会处理内含的检测结果。若设置该选项为0,Nagios将处理全部的检测结果文件-即便这些文件比你的硬件还老旧。
This option allows you to control how host checks that are scheduled to be checked on a regular basis are initially "spread out" in the event queue. Using a "smart" delay calculation (the default) will cause Nagios to calculate an average check interval and spread initial checks of all hosts out over that interval, thereby helping to eliminate CPU load spikes. Using no delay is generally not recommended. Using no delay will cause all host checks to be scheduled for execution at the same time. More information on how to estimate how the inter-check delay affects host check scheduling can be found here.Values are as follows:
- n = Don't use any delay - schedule all host checks to run immediately (i.e. at the same time!)
- d = Use a "dumb" delay of 1 second between host checks
- s = Use a "smart" delay calculation to spread host checks out evenly (default)
- x.xx = Use a user-supplied inter-check delay of x.xx seconds
This option determines the maximum number of minutes from when Nagios starts that all hosts (that are scheduled to be regularly checked) are checked. This option will automatically adjust the host_inter_check_delay_methodhost inter-check delay method (if necessary) to ensure that the initial checks of all hosts occur within the timeframe you specify. In general, this option will not have an affect on host check scheduling if scheduling information is being retained using the use_retained_scheduling_infouse_retained_scheduling_info option. Default value is 30 (minutes).
该选项指定了“单位间隔”是多少秒数,单位间隔用于计数计划队列处理、再次通知等。单位间隔在对象配置文件被用于决定以何频度运行服务检测、以何频度与联系人再通知等。
重要:默认值是60,这说明在对象配置文件里设定的“单位间隔”是60秒(1分钟)。我没测试过其他值,所以如果要用其他值要自担风险!
该选项决定了Nagios是否要试图自动地进行计划的自主检测主机与服务以使在之后的时间里检测更为“平滑”。这可以使得监控主机保持一个均衡的负载,也使得在持续检测之间的保持相对一致,其代价是要更刚性地按计划执行检测工作。
WARNING: THIS IS AN EXPERIMENTAL FEATURE AND MAY BE REMOVED IN FUTURE VERSIONS. ENABLING THIS OPTION CAN DEGRADE PERFORMANCE - RATHER THAN INCREASE IT - IF USED IMPROPERLY!
表 5.57. Auto-Rescheduling Interval
| 格式: | auto_rescheduling_interval=<seconds> |
| 样例: | auto_rescheduling_interval=30 |
This option determines how often (in seconds) Nagios will attempt to automatically reschedule checks. This option only has an effect if the auto_reschedule_checksauto_reschedule_checks option is enabled. Default is 30 seconds.
WARNING: THIS IS AN EXPERIMENTAL FEATURE AND MAY BE REMOVED IN FUTURE VERSIONS. ENABLING THE AUTO-RESCHEDULING OPTION CAN DEGRADE PERFORMANCE - RATHER THAN INCREASE IT - IF USED IMPROPERLY!
表 5.58. Auto-Rescheduling Window
| 格式: | auto_rescheduling_window=<seconds> |
| 样例: | auto_rescheduling_window=180 |
This option determines the "window" of time (in seconds) that Nagios will look at when automatically rescheduling checks. Only host and service checks that occur in the next X seconds (determined by this variable) will be rescheduled. This option only has an effect if the auto_reschedule_checksauto_reschedule_checks option is enabled. Default is 180 seconds (3 minutes).
WARNING: THIS IS AN EXPERIMENTAL FEATURE AND MAY BE REMOVED IN FUTURE VERSIONS. ENABLING THE AUTO-RESCHEDULING OPTION CAN DEGRADE PERFORMANCE - RATHER THAN INCREASE IT - IF USED IMPROPERLY!
Nagios tries to be smart about how and when it checks the status of hosts. In general, disabling this option will allow Nagios to make some smarter decisions and check hosts a bit faster. Enabling this option will increase the amount of time required to check hosts, but may improve reliability a bit. Unless you have problems with Nagios not recognizing that a host recovered, I would suggest not enabling this option.
- 0 = Don't use aggressive host checking (default)
- 1 = Use aggressive host checking
This option determines whether or not Nagios will DOWN/UNREACHABLE passive host check results to their "correct" state from the viewpoint of the local Nagios instance. This can be very useful in distributed and failover monitoring installations. More information on passive check state translation can be found here.
- 0 = Disable check translation (default)
- 1 = Enable check translation
表 5.61. Passive Host Checks Are SOFT Option
| 格式: | passive_host_checks_are_soft=<0/1> |
| 样例: | passive_host_checks_are_soft=1 |
This option determines whether or not Nagios will treat passive host checks as HARD states or SOFT states. By default, a passive host check result will put a host into a HARD state type. You can change this behavior by enabling this option.
- 0 = Passive host checks are HARD (default)
- 1 = Passive host checks are SOFT
表 5.62. Predictive Host Dependency Checks Option
| 格式: | enable_predictive_host_dependency_checks=<0/1> |
| 样例: | enable_predictive_host_dependency_checks=1 |
This option determines whether or not Nagios will execute predictive checks of hosts that are being dependended upon (as defined in host dependencies) for a particular host when it changes state.
Predictive checks help ensure that the dependency logic is as accurate as possible. More information on how predictive checks work can be found here.
- 0 = Disable predictive checks
- 1 = Enable predictive checks (default)
表 5.63. Predictive Service Dependency Checks Option
| 格式: | enable_predictive_service_dependency_checks=<0/1> |
| 样例: | enable_predictive_service_dependency_checks=1 |
This option determines whether or not Nagios will execute predictive checks of services that are being dependended upon (as defined in service dependencies) for a particular service when it changes state.
Predictive checks help ensure that the dependency logic is as accurate as possible. More information on how predictive checks work can be found here.
- 0 = Disable predictive checks
- 1 = Enable predictive checks (default)
表 5.64. Cached Host Check Horizon
| 格式: | cached_host_check_horizon=<seconds> |
| 样例: | cached_host_check_horizon=15 |
This option determines the maximum amount of time (in seconds) that the state of a previous host check is considered current. Cached host states (from host checks that were performed more recently than the time specified by this value) can improve host check performance immensely. Too high of a value for this option may result in (temporarily) inaccurate host states, while a low value may result in a performance hit for host checks. Use a value of 0 if you want to disable host check caching. More information on cached checks can be found here.
表 5.65. Cached Service Check Horizon
| 格式: | cached_service_check_horizon=<seconds> |
| 样例: | cached_service_check_horizon=15 |
This option determines the maximum amount of time (in seconds) that the state of a previous service check is considered current. Cached service states (from service checks that were performed more recently than the time specified by this value) can improve service check performance when a lot of service dependencies are used. Too high of a value for this option may result in inaccuracies in the service dependency logic. Use a value of 0 if you want to disable service check caching. More information on cached checks can be found here.
表 5.66. Large Installation Tweaks Option
| 格式: | use_large_installation_tweaks=<0/1> |
| 样例: | use_large_installation_tweaks=0 |
This option determines whether or not the Nagios daemon will take several shortcuts to improve performance. These shortcuts result in the loss of a few features, but larger installations will likely see a lot of benefit from doing so. More information on what optimizations are taken when you enable this option can be found here.
- 0 = Don't use tweaks (default)
- 1 = Use tweaks
This option determines whether or not Nagios will free memory in child processes when they are fork()ed off from the main process. By default, Nagios frees memory. However, if the use_large_installation_tweaks option is enabled, it will not. By defining this option in your configuration file, you are able to override things to get the behavior you want.
- 0 = Don't free memory
- 1 = Free memory
This option determines whether or not Nagios will fork() child processes twice when it executes host and service checks. By default, Nagios fork()s twice. However, if the use_large_installation_tweaks option is enabled, it will only fork() once. By defining this option in your configuration file, you are able to override things to get the behavior you want.
- 0 = Fork() just once
- 1 = Fork() twice
This option determines whether or not the Nagios daemon will make all standard macros available as environment variables to your check, notification, event hander, etc. commands. In large Nagios installations this can be problematic because it takes additional memory and (more importantly) CPU to compute the values of all macros and make them available to the environment.
- 0 = Don't make macros available as environment variables
- 1 = Make macros available as environment variables (default)
This option determines whether or not Nagios will try and detect hosts and services that are "flapping". Flapping occurs when a host or service changes between states too frequently, resulting in a barrage of notifications being sent out. When Nagios detects that a host or service is flapping, it will temporarily suppress notifications for that host/service until it stops flapping. Flap detection is very experimental at this point, so use this feature with caution! More information on how flap detection and handling works can be found here.注意:如果你使能retain_state_information状态保持选项(保存于state_retention_file状态保持文件中)而忽略这个设置,除非你已经关闭use_retained_program_state选项。如果你想在保持选项使能(且use_retained_program_state选项使能)的情况下修改这个选项,你只得用适当的外部命令或是通过Web接口来修改它。选项可用的值有:
- 0 = Don't enable flap detection (default)
- 1 = Enable flap detection
表 5.71. Low Service Flap Threshold
| 格式: | low_service_flap_threshold=<percent> |
| 样例: | low_service_flap_threshold=25.0 |
This option is used to set the low threshold for detection of service flapping. For more information on how flap detection and handling works (and how this option affects things) read this.
表 5.72. High Service Flap Threshold
| 格式: | high_service_flap_threshold=<percent> |
| 样例: | high_service_flap_threshold=50.0 |
This option is used to set the low threshold for detection of service flapping. For more information on how flap detection and handling works (and how this option affects things) read this.
This option is used to set the low threshold for detection of host flapping. For more information on how flap detection and handling works (and how this option affects things) read this.
表 5.74. High Host Flap Threshold
| 格式: | high_host_flap_threshold=<percent> |
| 样例: | high_host_flap_threshold=50.0 |
This option is used to set the low threshold for detection of host flapping. For more information on how flap detection and handling works (and how this option affects things) read this.
This option determines whether or not Nagios will use soft state information when checking host and service dependencies. Normally Nagios will only use the latest hard host or service state when checking dependencies. If you want it to use the latest state (regardless of whether its a soft or hard state type), enable this option.
- 0 = Don't use soft state dependencies (default)
- 1 = Use soft state dependencies
This is the maximum number of seconds that Nagios will allow service checks to run. If checks exceed this limit, they are killed and a 紧急 state is returned. A timeout error will also be logged.
There is often widespread confusion as to what this option really does. It is meant to be used as a last ditch mechanism to kill off plugins which are misbehaving and not exiting in a timely manner. It should be set to something high (like 60 seconds or more), so that each service check normally finishes executing within this time limit. If a service check runs longer than this limit, Nagios will kill it off thinking it is a runaway processes.
This is the maximum number of seconds that Nagios will allow host checks to run. If checks exceed this limit, they are killed and a 紧急 state is returned and the host will be assumed to be DOWN. A timeout error will also be logged.
There is often widespread confusion as to what this option really does. It is meant to be used as a last ditch mechanism to kill off plugins which are misbehaving and not exiting in a timely manner. It should be set to something high (like 60 seconds or more), so that each host check normally finishes executing within this time limit. If a host check runs longer than this limit, Nagios will kill it off thinking it is a runaway processes.
This is the maximum number of seconds that Nagios will allow event handlers to be run. If an event handler exceeds this time limit it will be killed and a warning will be logged.
There is often widespread confusion as to what this option really does. It is meant to be used as a last ditch mechanism to kill off commands which are misbehaving and not exiting in a timely manner. It should be set to something high (like 60 seconds or more), so that each event handler command normally finishes executing within this time limit. If an event handler runs longer than this limit, Nagios will kill it off thinking it is a runaway processes.
This is the maximum number of seconds that Nagios will allow notification commands to be run. If a notification command exceeds this time limit it will be killed and a warning will be logged.
There is often widespread confusion as to what this option really does. It is meant to be used as a last ditch mechanism to kill off commands which are misbehaving and not exiting in a timely manner. It should be set to something high (like 60 seconds or more), so that each notification command finishes executing within this time limit. If a notification command runs longer than this limit, Nagios will kill it off thinking it is a runaway processes.
This is the maximum number of seconds that Nagios will allow an ocsp_commandobsessive compulsive service processor command to be run. If a command exceeds this time limit it will be killed and a warning will be logged.
This is the maximum number of seconds that Nagios will allow an ochp_commandobsessive compulsive host processor command to be run. If a command exceeds this time limit it will be killed and a warning will be logged.
This is the maximum number of seconds that Nagios will allow a host_perfdata_commandhost performance data processor command or service_perfdata_commandservice performance data processor command to be run. If a command exceeds this time limit it will be killed and a warning will be logged.
This value determines whether or not Nagios will "obsess" over service checks results and run the ocsp_commandobsessive compulsive service processor command you define. I know - funny name, but it was all I could think of. This option is useful for performing distributed monitoring. If you're not doing distributed monitoring, don't enable this option.
- 0 = Don't obsess over services (default)
- 1 = Obsess over services
表 5.84. Obsessive Compulsive Service Processor Command
| 格式: | ocsp_command=<command> |
| 样例: | ocsp_command=obsessive_service_handler |
This option allows you to specify a command to be run after every service check, which can be useful in distributed monitoring. This command is executed after any event handler or notification commands. The command argument is the short name of a command definition that you define in your 对象配置文件. The maximum amount of time that this command can run is controlled by the ocsp_timeoutocsp_timeout option. More information on distributed monitoring can be found here. This command is only executed if the obsess_over_servicesobsess_over_services option is enabled globally and if the obsess_over_service directive in the service definition is enabled.
This value determines whether or not Nagios will "obsess" over host checks results and run the ochp_commandobsessive compulsive host processor command you define. I know - funny name, but it was all I could think of. This option is useful for performing distributed monitoring. If you're not doing distributed monitoring, don't enable this option.
- 0 = Don't obsess over hosts (default)
- 1 = Obsess over hosts
表 5.86. Obsessive Compulsive Host Processor Command
| 格式: | ochp_command=<command> |
| 样例: | ochp_command=obsessive_host_handler |
This option allows you to specify a command to be run after every host check, which can be useful in distributed monitoring. This command is executed after any event handler or notification commands. The command argument is the short name of a command definition that you define in your 对象配置文件. The maximum amount of time that this command can run is controlled by the ochp_timeoutochp_timeout option. More information on distributed monitoring can be found here. This command is only executed if the obsess_over_hostsobsess_over_hosts option is enabled globally and if the obsess_over_host directive in the host definition is enabled.
该选项决定Nagios是否要处理主机和服务检测性能数据。
- 0 = Don't process performance data (default)
- 1 = Process performance data
This option allows you to specify a command to be run after every host check to process host performance data that may be returned from the check. The command argument is the short name of a command definition that you define in your 对象配置文件. This command is only executed if the process_performance_dataprocess_performance_data option is enabled globally and if the process_perf_data directive in the host definition is enabled.
表 5.89. 服务性能数据处理命令
| 格式: | service_perfdata_command=<command> |
| 样例: | service_perfdata_command=process-service-perfdata |
This option allows you to specify a command to be run after every service check to process service performance data that may be returned from the check. The command argument is the short name of a command definition that you define in your 对象配置文件. This command is only executed if the process_performance_dataprocess_performance_data option is enabled globally and if the process_perf_data directive in the service definition is enabled.
表 5.90. 主机性能数据文件
| 格式: | host_perfdata_file=<file_name> |
| 样例: | host_perfdata_file=/usr/local/nagios/var/host-perfdata.dat |
This option allows you to specify a file to which host performance data will be written after every host check. Data will be written to the performance file as specified by the host_perfdata_file_templatehost_perfdata_file_template option. Performance data is only written to this file if the process_performance_dataprocess_performance_data option is enabled globally and if the process_perf_data directive in the host definition is enabled.
表 5.91. 服务性能数据文件
| 格式: | service_perfdata_file=<file_name> |
| 样例: | service_perfdata_file=/usr/local/nagios/var/service-perfdata.dat |
This option allows you to specify a file to which service performance data will be written after every service check. Data will be written to the performance file as specified by the service_perfdata_file_template option. Performance data is only written to this file if the process_performance_dataprocess_performance_data option is enabled globally and if the process_perf_data directive in the service definition is enabled.
表 5.92. 主机性能数据文件模板
| 格式: | host_perfdata_file_template=<template> |
| 样例: | host_perfdata_file_template=[HOSTPERFDATA]\t$TIMET$\t$HOSTNAME$\t$HOSTEXECUTIONTIME$ \t$HOSTOUTPUT$\t$HOSTPERFDATA$ |
This option determines what (and how) data is written to the host_perfdata_filehost performance data file. The template may contain macros, special characters (\t for tab, \r for carriage return, \n for newline) and plain text. A newline is automatically added after each write to the performance data file.
表 5.93. 服务性能数据文件模板
| 格式: | service_perfdata_file_template=<template> |
| 样例: | service_perfdata_file_template=[SERVICEPERFDATA]\t$TIMET$\t$HOSTNAME$\t$SERVICEDESC$\t $SERVICEEXECUTIONTIME$\t$SERVICELATENCY$\t$SERVICEOUTPUT$\t$SERVICEPERFDATA$ |
This option determines what (and how) data is written to the service performance data file. The template may contain macros, special characters (\t for tab, \r for carriage return, \n for newline) and plain text. A newline is automatically added after each write to the performance data file.
This option determines how the host_perfdata_filehost performance data file is opened. Unless the file is a named pipe you'll probably want to use the default mode of append.
- a = Open file in append mode (default)
- w = Open file in write mode
- p = Open in non-blocking read/write mode (useful when writing to pipes)
This option determines how the service performance data file is opened. Unless the file is a named pipe you'll probably want to use the default mode of append.
- a = Open file in append mode (default)
- w = Open file in write mode
- p = Open in non-blocking read/write mode (useful when writing to pipes)
表 5.96. 主机性能数据文件处理间隔
| 格式: | host_perfdata_file_processing_interval=<seconds> |
| 样例: | host_perfdata_file_processing_interval=0 |
This option allows you to specify the interval (in seconds) at which the host_perfdata_filehost performance data file is processed using the host_perfdata_file_processing_commandhost performance data file processing command. A value of 0 indicates that the performance data file should not be processed at regular intervals.
表 5.97. 服务性能数据文件处理间隔
| 格式: | service_perfdata_file_processing_interval=<seconds> |
| 样例: | service_perfdata_file_processing_interval=0 |
This option allows you to specify the interval (in seconds) at which the service_perfdata_fileservice performance data file is processed using the service_perfdata_file_processing_commandservice performance data file processing command. A value of 0 indicates that the performance data file should not be processed at regular intervals.
表 5.98. 主机性能数据文件处理命令
| 格式: | host_perfdata_file_processing_command=<command> |
| 样例: | host_perfdata_file_processing_command=process-host-perfdata-file |
This option allows you to specify the command that should be executed to process the host_perfdata_filehost performance data file. The command argument is the short name of a command definition that you define in your 对象配置文件. The interval at which this command is executed is determined by the host_perfdata_file_processing_intervalhost_perfdata_file_processing_interval directive.
表 5.99. 服务性能数据文件处理命令
| 格式: | service_perfdata_file_processing_command=<command> |
| 样例: | service_perfdata_file_processing_command=process-service-perfdata-file |
This option allows you to specify the command that should be executed to process the service_perfdata_fileservice performance data file. The command argument is the short name of a command definition that you define in your 对象配置文件. The interval at which this command is executed is determined by the service_perfdata_file_processing_intervalservice_perfdata_file_processing_interval directive.
This option allows you to enable or disable checks for orphaned service checks. Orphaned service checks are checks which have been executed and have been removed from the event queue, but have not had any results reported in a long time. Since no results have come back in for the service, it is not rescheduled in the event queue. This can cause service checks to stop being executed. Normally it is very rare for this to happen - it might happen if an external user or process killed off the process that was being used to execute a service check. If this option is enabled and Nagios finds that results for a particular service check have not come back, it will log an error message and reschedule the service check. If you start seeing service checks that never seem to get rescheduled, enable this option and see if you notice any log messages about orphaned services.
- 0 = Don't check for orphaned service checks
- 1 = Check for orphaned service checks (default)
This option allows you to enable or disable checks for orphaned hoste checks. Orphaned host checks are checks which have been executed and have been removed from the event queue, but have not had any results reported in a long time. Since no results have come back in for the host, it is not rescheduled in the event queue. This can cause host checks to stop being executed. Normally it is very rare for this to happen - it might happen if an external user or process killed off the process that was being used to execute a host check. If this option is enabled and Nagios finds that results for a particular host check have not come back, it will log an error message and reschedule the host check. If you start seeing host checks that never seem to get rescheduled, enable this option and see if you notice any log messages about orphaned hosts.
- 0 = Don't check for orphaned host checks
- 1 = Check for orphaned host checks (default)
This option determines whether or not Nagios will periodically check the "freshness" of service checks. Enabling this option is useful for helping to ensure that passive service checks are received in a timely manner. More information on freshness checking can be found here.
- 0 = Don't check service freshness
- 1 = Check service freshness (default)
表 5.103. 服务更新检测间隔
| 格式: | service_freshness_check_interval=<seconds> |
| 样例: | service_freshness_check_interval=60 |
This setting determines how often (in seconds) Nagios will periodically check the "freshness" of service check results. If you have disabled service freshness checking (with the check_service_freshnesscheck_service_freshness option), this option has no effect. More information on freshness checking can be found here.
This option determines whether or not Nagios will periodically check the "freshness" of host checks. Enabling this option is useful for helping to ensure that passive host checks are received in a timely manner. More information on freshness checking can be found here.
- 0 = Don't check host freshness
- 1 = Check host freshness (default)
This setting determines how often (in seconds) Nagios will periodically check the "freshness" of host check results. If you have disabled host freshness checking (with the check_host_freshnesscheck_host_freshness option), this option has no effect. More information on freshness checking can be found here.
表 5.106. Additional Freshness Threshold Latency Option
| 格式: | additional_freshness_latency=<#> |
| 样例: | additional_freshness_latency=15 |
This option determines the number of seconds Nagios will add to any host or services freshness threshold it automatically calculates (e.g. those not specified explicity by the user). More information on freshness checking can be found here.
This setting determines whether or not the embedded Perl interpreter is enabled on a program-wide basis. Nagios must be compiled with support for embedded Perl for this option to have an effect. More information on the embedded Perl interpreter can be found here.
表 5.108. Embedded Perl Implicit Use Option
| 格式: | use_embedded_perl_implicitly=<0/1> |
| 样例: | use_embedded_perl_implicitly=1 |
This setting determines whether or not the embedded Perl interpreter should be used for Perl plugins/scripts that do not explicitly enable/disable it. Nagios must be compiled with support for embedded Perl for this option to have an effect. More information on the embedded Perl interpreter and the effect of this setting can be found here.
This option allows you to specify what kind of date/time format Nagios should use in the web interface and date/time macros. Possible options (along with example output) include:
表 5.110.
| 选项 | 输出格式 | 输出样例 |
|---|---|---|
| us | MM/DD/YYYY HH:MM:SS | 06/30/2002 03:15:00 |
| euro | DD/MM/YYYY HH:MM:SS | 30/06/2002 03:15:00 |
| iso8601 | YYYY-MM-DD HH:MM:SS | 2002-06-30 03:15:00 |
| strict-iso8601 | YYYY-MM-DDTHH:MM:SS | 2002-06-30T03:15:00 |
This option allows you to override the default timezone that this instance of Nagios runs in. Useful if you have multiple instances of Nagios that need to run from the same server, but have different local times associated with them. If not specified, Nagios will use the system configured timezone.
Note: If you use this option to specify a custom timezone, you will also need to alter the Apache configuration directives for the CGIs to specify the timezone you want. Example:
<Directory "/usr/local/nagios/sbin/">
SetEnv TZ "US/Mountain"
...
</Directory>
表 5.112. 非法对象名字符
| 格式: | illegal_object_name_chars=<chars...> |
| 样例: | illegal_object_name_chars=`~!$%^&*"|'<>?,()= |
This option allows you to specify illegal characters that cannot be used in host names, service descriptions, or names of other object types. Nagios will allow you to use most characters in object definitions, but I recommend not using the characters shown in the example above. Doing may give you problems in the web interface, notification commands, etc.
This option allows you to specify illegal characters that should be stripped from macros before being used in notifications, event handlers, and other commands. This DOES NOT affect macros used in service or host check commands. You can choose to not strip out the characters shown in the example above, but I recommend you do not do this. Some of these characters are interpreted by the shell (i.e. the backtick) and can lead to security problems. The following macros are stripped of the characters you specify:
$HOSTOUTPUT$, $HOSTPERFDATA$, $HOSTACKAUTHOR$, $HOSTACKCOMMENT$, $SERVICEOUTPUT$, $SERVICEPERFDATA$, $SERVICEACKAUTHOR$, and $SERVICEACKCOMMENT$
This option determines whether or not various directives in your 对象定义 will be processed as regular expressions. More information on how this works can be found here.
- 0 = Don't use regular expression matching (default)
- 1 = Use regular expression matching
表 5.115. True Regular Expression Matching Option
| 格式: | use_true_regexp_matching=<0/1> |
| 样例: | use_true_regexp_matching=0 |
If you've enabled regular expression matching of various object directives using the use_regexp_matching option, this option will determine when object directives are treated as regular expressions. If this option is disabled (the default), directives will only be treated as regular expressions if the contain *, ?, +, or \.. If this option is enabled, all appropriate directives will be treated as regular expression - be careful when enabling this! More information on how this works can be found here.
- 0 = Don't use true regular expression matching (default)
- 1 = Use true regular expression matching
This is the email address for the administrator of the local machine (i.e. the one that Nagios is running on). This value can be used in notification commands by using the $ADMINEMAIL$macro.
表 5.117. 管理员BP机帐号
| 格式: | admin_pager=<pager_number_or_pager_email_gateway> |
| 样例: | admin_pager=pageroot@localhost.localdomain |
This is the pager number (or pager email gateway) for the administrator of the local machine (i.e. the one that Nagios is running on). The pager number/address can be used in notification commands by using the $ADMINPAGER$macro.
This option controls what (if any) data gets sent to the event broker and, in turn, to any loaded event broker modules. This is an advanced option. When in doubt, either broker nothing (if not using event broker modules) or broker everything (if using event broker modules). Possible values are shown below.
- 0 = Broker nothing
- -1 = Broker everything
- # = See BROKER_* definitions in source code (include/broker.h) for other values that can be OR'ed together
表 5.119. Event Broker Modules
| 格式: | broker_module=<modulepath> [moduleargs] |
| 样例: | broker_module=/usr/local/nagios/bin/ndomod.o cfg_file=/usr/local/nagios/etc/ndomod.cfg |
This directive is used to specify an event broker module that should by loaded by Nagios at startup. Use multiple directives if you want to load more than one module. Arguments that should be passed to the module at startup are seperated from the module path by a space.
!!! WARNING !!!
Do NOT overwrite modules while they are being used by Nagios or Nagios will crash in a fiery display of SEGFAULT glory. This is a bug/limitation either in dlopen(), the kernel, and/or the filesystem. And maybe Nagios...
The correct/safe way of updating a module is by using one of these methods:
- Shutdown Nagios, replace the module file, restart Nagios
- While Nagios is running... delete the original module file, move the new module file into place, restart Nagios
This option determines where Nagios should write debugging information. What (if any) information is written is determined by the debug_level and debug_verbosity options. You can have Nagios automaticaly rotate the debug file when it reaches a certain size by using the max_debug_file_size option.
该选项决定Nagios将往debug_file文件里写入什么调试信息。下面值是可以逻辑或关系:
- -1 = Log everything
- 0 = Log nothing (default)
- 1 = Function enter/exit information
- 2 = Config information
- 4 = Process information
- 8 = Scheduled event information
- 16 = Host/service check information
- 32 = Notification information
- 64 = Event broker information
This option determines how much debugging information Nagios should write to the debug_filedebug_file.
- 0 = Basic information
- 1 = More detailed information (default)
- 2 = Highly detailed information
该选项定义了以字节为单位的debug_file调试文件最大长度。如果文件增至大于该值,将会自动被命名为.old扩展名的文件,如果.old扩展名已经存在,那么旧.old文件将被删除。这可以保证在Nagios调试时磁盘空间不会过多占用而失控。
对象可以在一个用柔性化模板样式来定义,模板可使得对Nagios的配置管理更为容易,有关如果进行对象定义的基本信息可以查阅这篇文件。
一旦熟悉了如何进行对象定义的基础,需要阅读对象继承以在将来应用中配置更为鲁棒(就是尽量使用对象继承关系啦)。经验丰富的使用者可以在对象定义决窍一文中发掘到一些有关对象定义的高级特性.
关于对象的解释
下面在一些主要的对象的解释...
主机是监控逻辑中的核心对象之一。主机的重要属性有:
- 主机通常在网络中的物理设备(如服务器、工作站、路由器、交换机和打印机等);
- 主机有某种形式的地址(象IP或MAC地址);
- 主机有一个或多个绑定的服务;
- 主机与其他的主机间可以有父/子节点的关系,通常反应出真实世界里的网络联接关系,而联接关系会在网络可达性逻辑中用到。
主机组是一台或多台主机组成的组。主机成组可以如下工作更简单(1)在Nagios的Web接口里查看相关的主机状态(2)使用对象定义决窍来简化配置。

服务监控逻辑中的一个核心对象之一。在主机上的服务用户可以:
- 主机的属性(CPU负荷、磁盘利用率、启动时间等);
- 主机提供的服务(HTTP, POP3, FTP, SSH等等);
- 其他与主机有关的信息(DNS记录等);
服务组是一个或多个服务组成的组。服务组可以对如下工作更简单(1)在Nagios的Web接口里查看相关的服务状态(2)使用对象定义决窍来简化配置。

联系人是那些涉及到通知过程中的人:
- 有多种通知联系人的方法(对讲机、BP机、EMail、即时信息等);
- 联系人收到的通知来自于其负责的主机或服务;
联系人组是一个或多个联系人组成的组。联系人组可以简化在主机或服务故障时负责的人员划分。

时间周期用于控制:
- 主机或服务被监控的时间;
- 联系人可接收通知的时间;
时间段时如何工作的信息可以查阅这篇文档。

命令是指出Nagios用哪个程序、脚本等,它必须可执行后完成:
- 主机和服务检测
- 通知
- 事件处理
- 和其他...

注意
当创建或编辑配置文件时,要遵守如下要求:
- 以符号'#'开头的行将视为注释不做处理;
- 变量必须是新起的一行 - 变量之前不能有空格符;
- 变量名是大小写敏感的;
默认情况下,Nagios期望的CGI配置文件被命名为cgi.cfg并且该配置文件被放在了主配置文件指定的位置。如果你想改变名称和位置,你可以在Apache里配置一个环境变量叫做NAGIO_CGI_CONFIG的(里面设置好文件名和位置)给CGI程序用。如何来做可以查看Apache文档里的说明。
下面将给出每个主配置文件里的变量与值选项说明...
表 5.124. 主配置文件的位置
| 格式: | main_config_file=<file_name> |
| 举例: | main_config_file=/usr/local/nagios/etc/nagios.cfg |
它用于指向主配置文件所在的位置。CGI模块需要知道在哪里可以得到主配置文件以取得配置信息、当前的主机和服务的状态等。
它用于指明用于服务器或工作站上的HTML文件所在的系统路径。Nagios假定文档和图片文件被分别放在了docs/和images/两个子目录下。
如果通过Web浏览器来操作Nagios,你要通过一个URL如http://www.myhost.com/nagios来操作的话,则需要设置为/nagios。一般是用这个URL来操作Nagios的HTML页面。
该选项控制着CGI模块里,对于用户操作或是取得信息时是否需要打开认证和授权功能。如果你断定你不使用认证,一定要把CGI命令移走以免没有授权的用户发出Nagios命令。如果不使用认证功能,CGI模块不会向Nagios发出命令,但我同时也建议你也把CGI模块同时移到安全位置。更多的有关设置认证与授权的内容可以查看这个文件。
- 0 = 不使用认证功能
- 1 = 使用认主与授权功能(默认值)
用这个变量可以设置一个默认的用户来操作CGI程序。它可以在一个加密的域里(如在防火墙后建立的WEB)不需要WEB认证就可以操作CGI模块。你可能需要这个功能来避免仅仅在一个非加密的服务器上(通过因特网以明文方式来传递你的口令)来做基本的认证。
Important:除非你是在一个加密的WEB服务器上并且保证每个进入该域的用户都具备CGI操作权,否则的话,你不要定义这个默认用户。如果你决定用它,那么任何一个未经认证的WEB服务器用户都可以继承你设定的全部权限!
表 5.129. 系统和进程的信息操作权
| 格式: | authorized_for_system_information=<user1>,<user2>,<user3>,...<usern> |
| 举例: | authorized_for_system_information=nagiosadmin,theboss |
这是一个以逗号分陋的列表,列举出了在扩展CGI信息里查看系统和进程信息的可认证用户。在列表中列出的用户并不会自动被授权可发出系统和进程的命令。如果你想也同时可以发出系统和进程命令,你必须把这些用户也加到authorized_for_system_commands变量之中。更多的如何给CGI模块设置认证和配置授权的内容可以查阅这个文档。
表 5.130. 系统和进程的命令操作权
| 格式: | authorized_for_system_commands=<user1>,<user2>,<user3>,...<usern> |
| 举例: | authorized_for_system_commands=nagiosadmin |
这是一个以逗号分隔的列表,列出了可以通过CGI命令发出系统和进程命令的被认证用户。在列表中的用户并没有被自动授权查看系统和进程的信息。如果你想让用户也同时可以查看系统和进程信息的话,你必须把这些用户也加到authorized_for_system_information变量里面。更多的如何给CGI模块设置认证和配置授权的内容可以查阅这个文档。
表 5.131. 配置的信息获取权限
| 格式: | authorized_for_configuration_information=<user1>,<user2>,<user3>,...<usern> |
| 举例: | authorized_for_configuration_information=nagiosadmin |
这是一个以逗号分隔的列表,列出了可以通过配置查看CGI里查看配置信息的可认证用户。这些列表中的用户可以查看全部的配置好的主机、主机组、服务、联系人、联系人组等的配置信息。更多的如何给CGI模块设置认证和配置授权的内容可以查阅这个文档。
表 5.132. 全局主机的信息获取权限
| 格式: | authorized_for_all_hosts=<user1>,<user2>,<user3>,...<usern> |
| 举例: | authorized_for_all_hosts=nagiosadmin,theboss |
这是一个以逗号分隔的列表,列出了可以查看全部主机的状态和配置信息的被认证用户。这些列表中的用户同时被授权查看在全部的服务信息。但列表中的用户并没有自动地授权向全部的主机或服务发出命令。如果你想让这些用户同时可以向全部主机和服务发出命令,你必须将用户加入到authorized_for_all_host_commands变量里。更多的如何给CGI模块设置认证和配置授权的内容可以查阅这个文档。
表 5.133. 全局主机的命令操作权
| 格式: | authorized_for_all_host_commands=<user1>,<user2>,<user3>,...<usern> |
| 举例: | authorized_for_all_host_commands=nagiosadmin |
这是一个以逗号分隔的列表,列出了可以通过命令CGI功能模块向全部主机发出命令的被授权用户。列表中的用户同时自动地被授权可以向全部服务发出命令。但列表中的用户并没有自动地授权可以查看全部的主机或服务的状态和配置信息,如果你想让用户同样可以查看状态和配置信息,你需要将用户加入到authorized_for_all_hosts变量之中。更多的如何给CGI模块设置认证和配置授权的内容可以查阅这个文档。
表 5.134. 全局服务的信息获取权
| 格式: | authorized_for_all_services=<user1>,<user2>,<user3>,...<usern> |
| 举例: | authorized_for_all_services=nagiosadmin,theboss |
这是一个以逗号分隔的列表,列出了可以查看全部服务的状态和配置的被授权用户。但列表中的用户并没有自动地授权可以查看全部主机的信息。列表中的用户并没有自动地授权向全部服务发送命令。如果你想让这些用户也同样可以发全部服务发送命令,你必须将这些用户加入到authorized_for_all_service_commands变量之中。更多的如何给CGI模块设置认证和配置授权的内容可以查阅这个文档。
表 5.135. 全局服务的命令操作权
| 格式: | authorized_for_all_service_commands=<user1>,<user2>,<user3>,...<usern> |
| 举例: | authorized_for_all_service_commands=nagiosadmin |
这是一个以逗号分隔的列表,列出了可以通过命令CGI来向全部服务发送命令的被授权用户。但列表中的用户并没有自动地授权向全部主机发送命令。列表中的用户也没有自动地授权查看全部主机的状态和配置信息。如果你想让这些用户同样可以查年全部服务的状态和服务的信息,你必须把这些用户加入到authorized_for_all_services变量中。更多的如何给CGI模块设置认证和配置授权的内容可以查阅这个文档。
该选项将使用WEB接口时在提交注释、做内容确认和制订宕机计划等操作时限制修改已经他们的动作提交者的名字。如果该选项使能,那么用户在做这些进行命令时将不能修改发出操作者的名字。
- 0 = 允许用户在提交命令时修改名字
- 1 = 不许用户提交命令时修改名字(默认值)
表 5.137. 网络拓扑图的背景图设置
| 格式: | statusmap_background_image=<image_file> |
| 举例: | statusmap_background_image=smbackground.gd2 |
该选项将让你可以在使用网络拓扑图时可以指定一个图形文件做为背景图,如果你选择了使用用户定义坐标来绘制的二维网络拓扑图的话。该背景图文件将不能为其他绘制方式提供背景。它假定这个文件是放在图像文件的路径里了(如/usr/local/nagios/share/images)。该路径将自动地在physical_html_path域之后加上"/images"生成路径。注意,这个图像文件的格式可以是GIF、JPEG、PNG或GD2格式。而推荐是GD2格式的文件,因为它可以在生成二维图时降低CPU负荷。
这个选项将让你指定出网络拓扑图CGI的默认绘制方式,可用的选项值有:
表 5.139. Statusmap的<layout_number>取值
| Value | Layout Method |
|---|---|
| 0 | 用户定义坐标系 |
| 1 | 深度图 |
| 2 | 树形折叠图 |
| 3 | 平衡权图 |
| 4 | 圆形图 |
| 5 | 圆形图(出标记的) |
| 6 | 圆形图(气泡式) |
这个选项将让你指定一个你的对象实体在哪个三维空间的容纳器里展现。它默认是文件已经存放在指定的路径下了,该路径由physical_html_path域来指定。注意,这个文件必须是合格的虚拟现实建模(VRML)文件(如你可以在它的专用浏览器里可以查看它)。
该选项让你指定在三维空间图里对象的三维空间坐标的生成算法。可用的选项值有:
该选项将让你指定以秒为单位的对于CGI模块刷新的周期,CGI模块有状态列表、二维拓扑图和扩展信息等CGI模块。
表 5.144. 声音报警
| 格式: | host_unreachable_sound=<sound_file> host_down_sound=<sound_file> service_critical_sound=<sound_file> service_warning_sound=<sound_file> service_unknown_sound=<sound_file> |
| 举例: | host_unreachable_sound=hostu.wav host_down_sound=hostd.wav service_critical_sound=critical.wav service_warning_sound=warning.wav service_unknown_sound=unknown.wav |
这个选项将让你指定在查看状态列表时如果有故障发生,你的浏览器里将发出哪个声音文件。如果有故障将按指定的临界故障类型来播放不同的声音文件。这些临界的故障类型是一个或多个主机不可达,至少是一个或多个服务处于未知的状态(见上例中的次序)。声音文件将假定你放在了HTML目录的"media/"子目录里(如/usr/local/nagios/share/media)。
这个选项给出了当从WAP接口(使用statuswml CGI)做PING一个主机操作时的PING的语法。你必须给出包含全路径名的PING的执行文件及全部参数的命令行。命令中使用$HOSTADDRESS$宏来预指定在命令执行前对哪个地址替换并执行PING检测。
这个选项将决定是否在主机和服务(插件)的检测输出中包含使用HTML的扩展选项。如果你使能了它,你的插件将不能使用可点击的超链接标记。
这个选项决定了你的注释URL必须要显示的URL目标。合法的选项内容包括_blank、_self、_top、_parent或是其他合法目标的名字。
这个选项给定了框内对象的动作里显示的动作URL的目标。合法的选项值包括_blank、_self、_top、_parent或是任何其他合法目标名字。
这个选项决定了在WEB接口里与Splunk集成功能是否集成。如果使能它,你页面中将在许多地方呈现出"Splunk It"的链接,CGI模块页面(日志文件、告警历史、主机和服务的详细信息等)里都有。如果你想对特别的故障发生想知道原诿时很有用。更多关于Splunk的信息请访问http://www.splunk.com/。
这个选项设置了指向Splunk网站的URL。在enable_splunk_integration使能时这个URL被CGI模块用于指向Splunk。
Nagios对象格式的一个特点是可以创建上下继承关系的对象定义。一个如何实现对象继承关系的解释可查阅这篇文档。强烈建议你在阅读过下面内容后要再熟悉一下继承关系,因为它将使对象定义创建和维护变得更为容易,同样,还得阅读对象定义决窍一文以使一些冗长定义任务变得简短。
注意
当创建或编辑配置文件时,要遵守如下要求:- 以符号'#'开头的行将视为注释不做处理;
- 变量名是大小写敏感的;
需要着重指出一点,当修改了配置文件时有几个在主机、服务和联系人定义里的域值不会清除。有这种特性的对象域在下面被标记了星号(*)。这个原因是由于Nagios会将一些对象域值会用保存在状态保持文件里的值来覆盖配置文件,前提是配置了对程序内容全面地状态保持选项使能并且域里的值在运行时被外部命令修改过。
绕过这个问题的一个方法是将非状态信息的保持选项关闭掉,在主机、服务和联系人对象定义里用retain_nonstatus_information选项开关。关掉这个选项后会令Nagios在重启动时使用配置文件里给出的域值而不是从状态保持文件中取值。
描述:
主机被定义为存在于网络中的一个物理服务器、工作站或设备等。
定义格式:
注意
标记了(*)的域是必备的而黑色是可选的。
define host{
		host_name       host_name(*)
		alias       alias(*)
		display_name       display_name
		address       address(*)
		parents       host_names
		hostgroups       hostgroup_names
		check_command       command_name
		initial_state       [o,d,u]
		max_check_attempts       #(*)
		check_interval       #
		retry_interval       #
		active_checks_enabled       [0/1]
		passive_checks_enabled       [0/1]
		check_period       timeperiod_name(*)
		obsess_over_host       [0/1]
		check_freshness       [0/1]
		freshness_threshold       #
		event_handler       command_name
		event_handler_enabled       [0/1]
		low_flap_threshold       #
		high_flap_threshold       #
		flap_detection_enabled       [0/1]
		flap_detection_options       [o,d,u]
		process_perf_data       [0/1]
		retain_status_information       [0/1]
		retain_nonstatus_information       [0/1]
		contacts       contacts(*)
		contact_groups       contact_groups(*)
		notification_interval       #(*)
		first_notification_delay       #
		notification_period       timeperiod_name(*)
		notification_options       [d,u,r,f,s]
		notifications_enabled       [0/1]
		stalking_options       [o,d,u]
		notes       note_string
		notes_url       url
		action_url       url
		icon_image       image_file
		icon_image_alt       alt_string
		vrml_image       image_file
		statusmap_image       image_file
		2d_coords       x_coord,y_coord
		3d_coords       x_coord,y_coord,z_coord
		...
		}
定义样例:
define host{
		host_name			bogus-router
		alias				Bogus Router #1
		address				192.168.1.254
		parents				server-backbone
		check_command			check-host-alive
		check_interval			5
		retry_interval			1
		max_check_attempts		5
		check_period			24x7
		process_perf_data		0
		retain_nonstatus_information	0
		contact_groups			router-admins
		notification_interval		30
		notification_period		24x7
		notification_options		d,u,r
		}
域描述:
host_name: This directive is used to define a short name used to identify the host. It is used in host group and service definitions to reference this particular host. Hosts can have multiple services (which are monitored) associated with them. When used properly, the $HOSTNAME$ macro will contain this short name.
alias: This directive is used to define a longer name or description used to identify the host. It is provided in order to allow you to more easily identify a particular host. When used properly, the $HOSTALIAS$ macro will contain this alias/description.
address: This directive is used to define the address of the host. Normally, this is an IP address, although it could really be anything you want (so long as it can be used to check the status of the host). You can use a FQDN to identify the host instead of an IP address, but if DNS services are not availble this could cause problems. When used properly, the $HOSTADDRESS$ macro will contain this address. Note: If you do not specify an address directive in a host definition, the name of the host will be used as its address. A word of caution about doing this, however - if DNS fails, most of your service checks will fail because the plugins will be unable to resolve the host name.
display_name: This directive is used to define an alternate name that should be displayed in the web interface for this host. If not specified, this defaults to the value you specify for the host_name directive. Note: The current CGIs do not use this option, although future versions of the web interface will.
parents: This directive is used to define a comma-delimited list of short names of the "parent" hosts for this particular host. Parent hosts are typically routers, switches, firewalls, etc. that lie between the monitoring host and a remote hosts. A router, switch, etc. which is closest to the remote host is considered to be that host's "parent". Read the "Determining Status and Reachability of Network Hosts" document located here for more information. If this host is on the same network segment as the host doing the monitoring (without any intermediate routers, etc.) the host is considered to be on the local network and will not have a parent host. Leave this value blank if the host does not have a parent host (i.e. it is on the same segment as the Nagios host). The order in which you specify parent hosts has no effect on how things are monitored.
hostgroups: This directive is used to identify the short name(s) of the hostgroup(s) that the host belongs to. Multiple hostgroups should be separated by commas. This directive may be used as an alternative to (or in addition to) using the members directive in hostgroup definitions.
check_command: This directive is used to specify the short name of the command that should be used to check if the host is up or down. Typically, this command would try and ping the host to see if it is "alive". The command must return a status of OK (0) or Nagios will assume the host is down. If you leave this argument blank, the host will not be actively checked. Thus, Nagios will likely always assume the host is up (it may show up as being in a "PENDING" state in the web interface). This is useful if you are monitoring printers or other devices that are frequently turned off. The maximum amount of time that the notification command can run is controlled by the host_check_timeout option.
initial_state: By default Nagios will assume that all hosts are in UP states when in starts. You can override the initial state for a host by using this directive. Valid options are: o = UP, d = DOWN, and u = UNREACHABLE.
max_check_attempts: This directive is used to define the number of times that Nagios will retry the host check command if it returns any state other than an OK state. Setting this value to 1 will cause Nagios to generate an alert without retrying the host check again. Note: If you do not want to check the status of the host, you must still set this to a minimum value of 1. To bypass the host check, just leave the check_command option blank.
check_interval: This directive is used to define the number of "time units" between regularly scheduled checks of the host. Unless you've changed the interval_length directive from the default value of 60, this number will mean minutes. More information on this value can be found in the check scheduling documentation.
retry_interval: This directive is used to define the number of "time units" to wait before scheduling a re-check of the hosts. Hosts are rescheduled at the retry interval when the have changed to a non-UP state. Once the host has been retried max_attempts times without a change in its status, it will revert to being scheduled at its "normal" rate as defined by the check_interval value. Unless you've changed the interval_length directive from the default value of 60, this number will mean minutes. More information on this value can be found in the check scheduling documentation.
active_checks_enabled **: This directive is used to determine whether or not active checks (either regularly scheduled or on-demand) of this host are enabled. Values: 0 = disable active host checks, 1 = enable active host checks.
passive_checks_enabled **: This directive is used to determine whether or not passive checks are enabled for this host. Values: 0 = disable passive host checks, 1 = enable passive host checks.
check_period: This directive is used to specify the short name of the time period during which active checks of this host can be made.
obsess_over_host **: This directive determines whether or not checks for the host will be "obsessed" over using the ochp_command.
check_freshness **: This directive is used to determine whether or not freshness checks are enabled for this host. Values: 0 = disable freshness checks, 1 = enable freshness checks.
freshness_threshold: This directive is used to specify the freshness threshold (in seconds) for this host. If you set this directive to a value of 0, Nagios will determine a freshness threshold to use automatically.
event_handler: This directive is used to specify the short name of the command that should be run whenever a change in the state of the host is detected (i.e. whenever it goes down or recovers). Read the documentation on event handlers for a more detailed explanation of how to write scripts for handling events. The maximum amount of time that the event handler command can run is controlled by the event_handler_timeout option.
event_handler_enabled **: This directive is used to determine whether or not the event handler for this host is enabled. Values: 0 = disable host event handler, 1 = enable host event handler.
low_flap_threshold: This directive is used to specify the low state change threshold used in flap detection for this host. More information on flap detection can be found here. If you set this directive to a value of 0, the program-wide value specified by the low_host_flap_threshold directive will be used.
high_flap_threshold: This directive is used to specify the high state change threshold used in flap detection for this host. More information on flap detection can be found here. If you set this directive to a value of 0, the program-wide value specified by the high_host_flap_threshold directive will be used.
flap_detection_enabled **: This directive is used to determine whether or not flap detection is enabled for this host. More information on flap detection can be found here. Values: 0 = disable host flap detection, 1 = enable host flap detection.
flap_detection_options: This directive is used to determine what host states the flap detection logic will use for this host. Valid options are a combination of one or more of the following: o = UP states, d = DOWN states, u = UNREACHABLE states.
process_perf_data **: This directive is used to determine whether or not the processing of performance data is enabled for this host. Values: 0 = disable performance data processing, 1 = enable performance data processing.
retain_status_information: This directive is used to determine whether or not status-related information about the host is retained across program restarts. This is only useful if you have enabled state retention using the retain_state_information directive. Value: 0 = disable status information retention, 1 = enable status information retention.
retain_nonstatus_information: This directive is used to determine whether or not non-status information about the host is retained across program restarts. This is only useful if you have enabled state retention using the retain_state_information directive. Value: 0 = disable non-status information retention, 1 = enable non-status information retention.
contacts: This is a list of the short names of the contacts that should be notified whenever there are problems (or recoveries) with this host. Multiple contacts should be separated by commas. Useful if you want notifications to go to just a few people and don't want to configure contact groups. You must specify at least one contact or contact group in each host definition.
contact_groups: This is a list of the short names of the contact groups that should be notified whenever there are problems (or recoveries) with this host. Multiple contact groups should be separated by commas. You must specify at least one contact or contact group in each host definition.
notification_interval: This directive is used to define the number of "time units" to wait before re-notifying a contact that this server is still down or unreachable. Unless you've changed the interval_length directive from the default value of 60, this number will mean minutes. If you set this value to 0, Nagios will not re-notify contacts about problems for this host - only one problem notification will be sent out.
first_notification_delay: This directive is used to define the number of "time units" to wait before sending out the first problem notification when this host enters a non-UP state. Unless you've changed the interval_length directive from the default value of 60, this number will mean minutes. If you set this value to 0, Nagios will start sending out notifications immediately.
notification_period: This directive is used to specify the short name of the time period during which notifications of events for this host can be sent out to contacts. If a host goes down, becomes unreachable, or recoveries during a time which is not covered by the time period, no notifications will be sent out.
notification_options: This directive is used to determine when notifications for the host should be sent out. Valid options are a combination of one or more of the following: d = send notifications on a DOWN state, u = send notifications on an UNREACHABLE state, r = send notifications on recoveries (OK state), f = send notifications when the host starts and stops flapping, and s = send notifications when scheduled downtime starts and ends. If you specify n (none) as an option, no host notifications will be sent out. If you do not specify any notification options, Nagios will assume that you want notifications to be sent out for all possible states. Example: If you specify d,r in this field, notifications will only be sent out when the host goes DOWN and when it recovers from a DOWN state.
notifications_enabled **: This directive is used to determine whether or not notifications for this host are enabled. Values: 0 = disable host notifications, 1 = enable host notifications.
stalking_options: This directive determines which host states "stalking" is enabled for. Valid options are a combination of one or more of the following: o = stalk on UP states, d = stalk on DOWN states, and u = stalk on UNREACHABLE states. More information on state stalking can be found here.
notes: This directive is used to define an optional string of notes pertaining to the host. If you specify a note here, you will see the it in the extended information CGI (when you are viewing information about the specified host).
notes_url: This variable is used to define an optional URL that can be used to provide more information about the host. If you specify an URL, you will see a red folder icon in the CGIs (when you are viewing host information) that links to the URL you specify here. Any valid URL can be used. If you plan on using relative paths, the base path will the the same as what is used to access the CGIs (i.e. /cgi-bin/nagios/). This can be very useful if you want to make detailed information on the host, emergency contact methods, etc. available to other support staff.
action_url: This directive is used to define an optional URL that can be used to provide more actions to be performed on the host. If you specify an URL, you will see a red "splat" icon in the CGIs (when you are viewing host information) that links to the URL you specify here. Any valid URL can be used. If you plan on using relative paths, the base path will the the same as what is used to access the CGIs (i.e. /cgi-bin/nagios/).
icon_image: This variable is used to define the name of a GIF, PNG, or JPG image that should be associated with this host. This image will be displayed in the various places in the CGIs. The image will look best if it is 40x40 pixels in size. Images for hosts are assumed to be in the logos/ subdirectory in your HTML images directory (i.e. /usr/local/nagios/share/images/logos).
icon_image_alt: This variable is used to define an optional string that is used in the ALT tag of the image specified by the <icon_image> argument.
vrml_image: This variable is used to define the name of a GIF, PNG, or JPG image that should be associated with this host. This image will be used as the texture map for the specified host in the statuswrl CGI. Unlike the image you use for the <icon_image> variable, this one should probably not have any transparency. If it does, the host object will look a bit wierd. Images for hosts are assumed to be in the logos/ subdirectory in your HTML images directory (i.e. /usr/local/nagios/share/images/logos).
statusmap_image: This variable is used to define the name of an image that should be associated with this host in the statusmap CGI. You can specify a JPEG, PNG, and GIF image if you want, although I would strongly suggest using a GD2 format image, as other image formats will result in a lot of wasted CPU time when the statusmap image is generated. GD2 images can be created from PNG images by using the pngtogd2 utility supplied with Thomas Boutell's gd library. The GD2 images should be created in uncompressed format in order to minimize CPU load when the statusmap CGI is generating the network map image. The image will look best if it is 40x40 pixels in size. You can leave these option blank if you are not using the statusmap CGI. Images for hosts are assumed to be in the logos/ subdirectory in your HTML images directory (i.e. /usr/local/nagios/share/images/logos).
2d_coords: This variable is used to define coordinates to use when drawing the host in the statusmap CGI. Coordinates should be given in positive integers, as the correspond to physical pixels in the generated image. The origin for drawing (0,0) is in the upper left hand corner of the image and extends in the positive x direction (to the right) along the top of the image and in the positive y direction (down) along the left hand side of the image. For reference, the size of the icons drawn is usually about 40x40 pixels (text takes a little extra space). The coordinates you specify here are for the upper left hand corner of the host icon that is drawn. Note: Don't worry about what the maximum x and y coordinates that you can use are. The CGI will automatically calculate the maximum dimensions of the image it creates based on the largest x and y coordinates you specify.
3d_coords: This variable is used to define coordinates to use when drawing the host in the statuswrl CGI. Coordinates can be positive or negative real numbers. The origin for drawing is (0.0,0.0,0.0). For reference, the size of the host cubes drawn is 0.5 units on each side (text takes a little more space). The coordinates you specify here are used as the center of the host cube.
描述:
主机组是指一台或多台主机构成的组,可使配置更简单或是为完成特定目的而在CGI里显示使用。
定义格式:
注意
标记了(*)的域是必备的而黑色是可选的。
define hostgroup{
		hostgroup_name       hostgroup_name(*)
		alias       alias(*)
		members       hosts
		hostgroup_members       hostgroups
		notes       note_string
		notes_url       url
		action_url       url
		...
		}
定义样例:
define hostgroup{
		hostgroup_name		novell-servers
		alias			Novell Servers
		members			netware1,netware2,netware3,netware4
		}
域描述:
hostgroup_name: This directive is used to define a short name used to identify the host group.
alias: This directive is used to define is a longer name or description used to identify the host group. It is provided in order to allow you to more easily identify a particular host group.
members: This is a list of the short names of hosts that should be included in this group. Multiple host names should be separated by commas. This directive may be used as an alternative to (or in addition to) the hostgroups directive in host definitions.
hostgroup_members: This optional directive can be used to include hosts from other "sub" host groups in this host group. Specify a comma-delimited list of short names of other host groups whose members should be included in this group.
notes: This directive is used to define an optional string of notes pertaining to the host. If you specify a note here, you will see the it in the extended information CGI (when you are viewing information about the specified host).
notes_url: This variable is used to define an optional URL that can be used to provide more information about the host group. If you specify an URL, you will see a red folder icon in the CGIs (when you are viewing hostgroup information) that links to the URL you specify here. Any valid URL can be used. If you plan on using relative paths, the base path will the the same as what is used to access the CGIs (i.e. /cgi-bin/nagios/). This can be very useful if you want to make detailed information on the host group, emergency contact methods, etc. available to other support staff.
action_url: This directive is used to define an optional URL that can be used to provide more actions to be performed on the host group. If you specify an URL, you will see a red "splat" icon in the CGIs (when you are viewing hostgroup information) that links to the URL you specify here. Any valid URL can be used. If you plan on using relative paths, the base path will the the same as what is used to access the CGIs (i.e. /cgi-bin/nagios/).
描述:
服务定义为在主机上运行的某种“应用服务”。这种服务定义得非常宽泛,可以是在主机上实际的服务进程(POP3、SMTP、HTTP等)或是与主机有关的某种计量值(PING响应值、在线用户数、磁盘空闲空间等),其中的差异见下面的说明。
定义格式:
注意
标记了(*)的域是必备的而黑色是可选的。
define service{
		host_name       host_name(*)
		hostgroup_name       hostgroup_name
		service_description       service_description(*)
		display_name       display_name
		servicegroups       servicegroup_names
		is_volatile       [0/1]
		check_command       command_name(*)
		initial_state       [o,w,u,c]
		max_check_attempts       #(*)
		check_interval       #(*)
		retry_interval       #(*)
		active_checks_enabled       [0/1]
		passive_checks_enabled       [0/1]
		check_period       timeperiod_name(*)
		obsess_over_service       [0/1]
		check_freshness       [0/1]
		freshness_threshold       #
		event_handler       command_name
		event_handler_enabled       [0/1]
		low_flap_threshold       #
		high_flap_threshold       #
		flap_detection_enabled       [0/1]
		flap_detection_options       [o,w,c,u]
		process_perf_data       [0/1]
		retain_status_information       [0/1]
		retain_nonstatus_information       [0/1]
		notification_interval       #(*)
		first_notification_delay       #
		notification_period       timeperiod_name(*)
		notification_options       [w,u,c,r,f,s]
		notifications_enabled       [0/1]
		contacts       contacts(*)
		contact_groups       contact_groups(*)
		stalking_options       [o,w,u,c]
		notes       note_string
		notes_url       url
		action_url       url
		icon_image       image_file
		icon_image_alt       alt_string
		...
		}
定义样例:
define service{
		host_name		linux-server
		service_description	check-disk-sda1
		check_command		check-disk!/dev/sda1
		max_check_attempts	5
		check_interval	5
		retry_interval	3
		check_period		24x7
		notification_interval	30
		notification_period	24x7
		notification_options	w,c,r
		contact_groups		linux-admins
		}
域描述:
host_name: This directive is used to specify the short name(s) of the host(s) that the service "runs" on or is associated with. Multiple hosts should be separated by commas.
hostgroup_name: This directive is used to specify the short name(s) of the hostgroup(s) that the service "runs" on or is associated with. Multiple hostgroups should be separated by commas. The hostgroup_name may be used instead of, or in addition to, the host_name directive.
service_description;: This directive is used to define the description of the service, which may contain spaces, dashes, and colons (semicolons, apostrophes, and quotation marks should be avoided). No two services associated with the same host can have the same description. Services are uniquely identified with their host_name and service_description directives.
display_name: This directive is used to define an alternate name that should be displayed in the web interface for this service. If not specified, this defaults to the value you specify for the service_description directive. Note: The current CGIs do not use this option, although future versions of the web interface will.
servicegroups: This directive is used to identify the short name(s) of the servicegroup(s) that the service belongs to. Multiple servicegroups should be separated by commas. This directive may be used as an alternative to using the members directive in servicegroup definitions.
is_volatile: This directive is used to denote whether the service is "volatile". Services are normally not volatile. More information on volatile service and how they differ from normal services can be found here. Value: 0 = service is not volatile, 1 = service is volatile.
check_command: This directive is used to specify the short name of the command that Nagios will run in order to check the status of the service. The maximum amount of time that the service check command can run is controlled by the service_check_timeout option.
initial_state: By default Nagios will assume that all services are in OK states when in starts. You can override the initial state for a service by using this directive. Valid options are: o = 正常(OK), w = 告警(WARNING), u = 未知(UNKNOWN), and c = 紧急(CRITICAL).
max_check_attempts: This directive is used to define the number of times that Nagios will retry the service check command if it returns any state other than an OK state. Setting this value to 1 will cause Nagios to generate an alert without retrying the service check again.
check_interval: This directive is used to define the number of "time units" to wait before scheduling the next "regular" check of the service. "Regular" checks are those that occur when the service is in an OK state or when the service is in a non-OK state, but has already been rechecked max_attempts number of times. Unless you've changed the interval_length directive from the default value of 60, this number will mean minutes. More information on this value can be found in the check scheduling documentation.
retry_interval: This directive is used to define the number of "time units" to wait before scheduling a re-check of the service. Services are rescheduled at the retry interval when the have changed to a non-OK state. Once the service has been retried max_attempts times without a change in its status, it will revert to being scheduled at its "normal" rate as defined by the check_interval value. Unless you've changed the interval_length directive from the default value of 60, this number will mean minutes. More information on this value can be found in the check scheduling documentation.
active_checks_enabled **: This directive is used to determine whether or not active checks of this service are enabled. Values: 0 = disable active service checks, 1 = enable active service checks.
passive_checks_enabled **: This directive is used to determine whether or not passive checks of this service are enabled. Values: 0 = disable passive service checks, 1 = enable passive service checks.
check_period: This directive is used to specify the short name of the time period during which active checks of this service can be made.
obsess_over_service **: This directive determines whether or not checks for the service will be "obsessed" over using the ocsp_command.
check_freshness **: This directive is used to determine whether or not freshness checks are enabled for this service. Values: 0 = disable freshness checks, 1 = enable freshness checks.
freshness_threshold: This directive is used to specify the freshness threshold (in seconds) for this service. If you set this directive to a value of 0, Nagios will determine a freshness threshold to use automatically.
event_handler_enabled **: This directive is used to determine whether or not the event handler for this service is enabled. Values: 0 = disable service event handler, 1 = enable service event handler.
low_flap_threshold: This directive is used to specify the low state change threshold used in flap detection for this service. More information on flap detection can be found here. If you set this directive to a value of 0, the program-wide value specified by the low_service_flap_threshold directive will be used.
high_flap_threshold: This directive is used to specify the high state change threshold used in flap detection for this service. More information on flap detection can be found here. If you set this directive to a value of 0, the program-wide value specified by the high_service_flap_threshold directive will be used.
flap_detection_enabled **: This directive is used to determine whether or not flap detection is enabled for this service. More information on flap detection can be found here. Values: 0 = disable service flap detection, 1 = enable service flap detection.
flap_detection_options: This directive is used to determine what service states the flap detection logic will use for this service. Valid options are a combination of one or more of the following: o = OK states, w = WARNING states, c = CRITICAL states, u = UNKNOWN states.
process_perf_data **: This directive is used to determine whether or not the processing of performance data is enabled for this service. Values: 0 = disable performance data processing, 1 = enable performance data processing.
retain_status_information: This directive is used to determine whether or not status-related information about the service is retained across program restarts. This is only useful if you have enabled state retention using the retain_state_information directive. Value: 0 = disable status information retention, 1 = enable status information retention.
retain_nonstatus_information: This directive is used to determine whether or not non-status information about the service is retained across program restarts. This is only useful if you have enabled state retention using the retain_state_information directive. Value: 0 = disable non-status information retention, 1 = enable non-status information retention.
notification_interval: This directive is used to define the number of "time units" to wait before re-notifying a contact that this service is still in a non-OK state. Unless you've changed the interval_length directive from the default value of 60, this number will mean minutes. If you set this value to 0, Nagios will not re-notify contacts about problems for this service - only one problem notification will be sent out.
first_notification_delay: This directive is used to define the number of "time units" to wait before sending out the first problem notification when this service enters a non-OK state. Unless you've changed the interval_length directive from the default value of 60, this number will mean minutes. If you set this value to 0, Nagios will start sending out notifications immediately.
notification_period: This directive is used to specify the short name of the time period during which notifications of events for this service can be sent out to contacts. No service notifications will be sent out during times which is not covered by the time period.
notification_options: This directive is used to determine when notifications for the service should be sent out. Valid options are a combination of one or more of the following: w = send notifications on a WARNING state, u = send notifications on an UNKNOWN state, c = send notifications on a CRITICAL state, r = send notifications on recoveries (OK state), f = send notifications when the service starts and stops flapping, and s = send notifications when scheduled downtime starts and ends. If you specify n (none) as an option, no service notifications will be sent out. If you do not specify any notification options, Nagios will assume that you want notifications to be sent out for all possible states. Example: If you specify w,r in this field, notifications will only be sent out when the service goes into a WARNING state and when it recovers from a WARNING state.
notifications_enabled **: This directive is used to determine whether or not notifications for this service are enabled. Values: 0 = disable service notifications, 1 = enable service notifications.
contacts: This is a list of the short names of the contacts that should be notified whenever there are problems (or recoveries) with this service. Multiple contacts should be separated by commas. Useful if you want notifications to go to just a few people and don't want to configure contact groups. You must specify at least one contact or contact group in each service definition.
contact_groups: This is a list of the short names of the contact groups that should be notified whenever there are problems (or recoveries) with this service. Multiple contact groups should be separated by commas. You must specify at least one contact or contact group in each service definition.
stalking_options: This directive determines which service states "stalking" is enabled for. Valid options are a combination of one or more of the following: o = stalk on OK states, w = stalk on WARNING states, u = stalk on UNKNOWN states, and c = stalk on CRITICAL states. More information on state stalking can be found here.
notes: This directive is used to define an optional string of notes pertaining to the service. If you specify a note here, you will see the it in the extended information CGI (when you are viewing information about the specified service).
notes_url: This directive is used to define an optional URL that can be used to provide more information about the service. If you specify an URL, you will see a red folder icon in the CGIs (when you are viewing service information) that links to the URL you specify here. Any valid URL can be used. If you plan on using relative paths, the base path will the the same as what is used to access the CGIs (i.e. /cgi-bin/nagios/). This can be very useful if you want to make detailed information on the service, emergency contact methods, etc. available to other support staff.
action_url: This directive is used to define an optional URL that can be used to provide more actions to be performed on the service. If you specify an URL, you will see a red "splat" icon in the CGIs (when you are viewing service information) that links to the URL you specify here. Any valid URL can be used. If you plan on using relative paths, the base path will the the same as what is used to access the CGIs (i.e. /cgi-bin/nagios/).
icon_image: This variable is used to define the name of a GIF, PNG, or JPG image that should be associated with this host. This image will be displayed in the status and extended information CGIs. The image will look best if it is 40x40 pixels in size. Images for hosts are assumed to be in the logos/ subdirectory in your HTML images directory (i.e. /usr/local/nagios/share/images/logos).
icon_image_alt: This variable is used to define an optional string that is used in the ALT tag of the image specified by the <icon_image> argument. The ALT tag is used in the status, extended information and statusmap CGIs.
描述:
A service group definition is used to group one or more services together for simplifying configuration with object tricks or display purposes in the CGIs.
定义格式:
注意
标记了(*)的域是必备的而黑色是可选的。
define servicegroup{
		servicegroup_name       servicegroup_name(*)
		alias       alias(*)
		members       services
		servicegroup_members       servicegroups
		notes       note_string
		notes_url       url
		action_url       url
		...
    		}
定义样例:
define servicegroup{
		servicegroup_name	dbservices
		alias			Database Services
		members			ms1,SQL Server,ms1,SQL Server Agent,ms1,SQL DTC
		}
域描述:
servicegroup_name: This directive is used to define a short name used to identify the service group.
alias: This directive is used to define is a longer name or description used to identify the service group. It is provided in order to allow you to more easily identify a particular service group.
members:
servicegroup_members: This optional directive can be used to include services from other "sub" service groups in this service group. Specify a comma-delimited list of short names of other service groups whose members should be included in this group.
notes: This directive is used to define an optional string of notes pertaining to the service group. If you specify a note here, you will see the it in the extended information CGI (when you are viewing information about the specified service group).
notes_url: This directive is used to define an optional URL that can be used to provide more information about the service group. If you specify an URL, you will see a red folder icon in the CGIs (when you are viewing service group information) that links to the URL you specify here. Any valid URL can be used. If you plan on using relative paths, the base path will the the same as what is used to access the CGIs (i.e. /cgi-bin/nagios/). This can be very useful if you want to make detailed information on the service group, emergency contact methods, etc. available to other support staff.
action_url: This directive is used to define an optional URL that can be used to provide more actions to be performed on the service group. If you specify an URL, you will see a red "splat" icon in the CGIs (when you are viewing service group information) that links to the URL you specify here. Any valid URL can be used. If you plan on using relative paths, the base path will the the same as what is used to access the CGIs (i.e. /cgi-bin/nagios/).
描述:
A contact definition is used to identify someone who should be contacted in the event of a problem on your network. The different arguments to a contact definition are described below.
定义格式:
注意
标记了(*)的域是必备的而黑色是可选的。
define contact{
		contact_name       contact_name(*)
		alias       alias(*)
		contactgroups       contactgroup_names
		host_notifications_enabled       [0/1](*)
		service_notifications_enabled       [0/1](*)
		host_notification_period       timeperiod_name(*)
		service_notification_period       timeperiod_name(*)
		host_notification_options       [d,u,r,f,s,n](*)
		service_notification_options       [w,u,c,r,f,s,n](*)
		host_notification_commands       command_name(*)
		service_notification_commands       command_name(*)
		email       email_address
		pager       pager_number or pager_email_gateway
		addressx       additional_contact_address
		can_submit_commands       [0/1]
		retain_status_information       [0/1]
		retain_nonstatus_information       [0/1]
		...
		}
定义样例:
define contact{
		contact_name                    jdoe
		alias                           John Doe
		host_notifications_enabled		1
		service_notifications_enabled	1
		service_notification_period     24x7
		host_notification_period        24x7
		service_notification_options    w,u,c,r
		host_notification_options       d,u,r
		service_notification_commands   notify-by-email
		host_notification_commands      host-notify-by-email
		email			jdoe@localhost.localdomain
		pager			555-5555@pagergateway.localhost.localdomain
		address1			xxxxx.xyyy@icq.com
		address2			555-555-5555
		can_submit_commands	1
		}
域描述:
contact_name: This directive is used to define a short name used to identify the contact. It is referenced in contact group definitions. Under the right circumstances, the $CONTACTNAME$ macro will contain this value.
alias: This directive is used to define a longer name or description for the contact. Under the rights circumstances, the $CONTACTALIAS$ macro will contain this value.
contactgroups: This directive is used to identify the short name(s) of the contactgroup(s) that the contact belongs to. Multiple contactgroups should be separated by commas. This directive may be used as an alternative to (or in addition to) using the members directive in contactgroup definitions.
host_notifications_enabled: This directive is used to determine whether or not the contact will receive notifications about host problems and recoveries. Values: 0 = don't send notifications, 1 = send notifications.
service_notifications_enabled: This directive is used to determine whether or not the contact will receive notifications about service problems and recoveries. Values: 0 = don't send notifications, 1 = send notifications.
host_notification_period: This directive is used to specify the short name of the time period during which the contact can be notified about host problems or recoveries. You can think of this as an "on call" time for host notifications for the contact. Read the documentation on time periods for more information on how this works and potential problems that may result from improper use.
service_notification_period: This directive is used to specify the short name of the time period during which the contact can be notified about service problems or recoveries. You can think of this as an "on call" time for service notifications for the contact. Read the documentation on time periods for more information on how this works and potential problems that may result from improper use.
host_notification_commands: This directive is used to define a list of the short names of the commands used to notify the contact of a host problem or recovery. Multiple notification commands should be separated by commas. All notification commands are executed when the contact needs to be notified. The maximum amount of time that a notification command can run is controlled by the notification_timeout option.
host_notification_options: This directive is used to define the host states for which notifications can be sent out to this contact. Valid options are a combination of one or more of the following: d = notify on DOWN host states, u = notify on UNREACHABLE host states, r = notify on host recoveries (UP states), f = notify when the host starts and stops flapping, and s = send notifications when host or service scheduled downtime starts and ends. If you specify n (none) as an option, the contact will not receive any type of host notifications.
service_notification_options: This directive is used to define the service states for which notifications can be sent out to this contact. Valid options are a combination of one or more of the following: w = notify on WARNING service states, u = notify on UNKNOWN service states, c = notify on CRITICAL service states, r = notify on service recoveries (OK states), and f = notify when the service starts and stops flapping. If you specify n (none) as an option, the contact will not receive any type of service notifications.
service_notification_commands: This directive is used to define a list of the short names of the commands used to notify the contact of a service problem or recovery. Multiple notification commands should be separated by commas. All notification commands are executed when the contact needs to be notified. The maximum amount of time that a notification command can run is controlled by the notification_timeout option.
email: This directive is used to define an email address for the contact. Depending on how you configure your notification commands, it can be used to send out an alert email to the contact. Under the right circumstances, the $CONTACTEMAIL$ macro will contain this value.
pager: This directive is used to define a pager number for the contact. It can also be an email address to a pager gateway (i.e. pagejoe@pagenet.com). Depending on how you configure your notification commands, it can be used to send out an alert page to the contact. Under the right circumstances, the $CONTACTPAGER$ macro will contain this value.
addressx: Address directives are used to define additional "addresses" for the contact. These addresses can be anything - cell phone numbers, instant messaging addresses, etc. Depending on how you configure your notification commands, they can be used to send out an alert o the contact. Up to six addresses can be defined using these directives (address1 through address6). The $CONTACTADDRESSx$ macro will contain this value.
can_submit_commands: This directive is used to determine whether or not the contact can submit external commands to Nagios from the CGIs. Values: 0 = don't allow contact to submit commands, 1 = allow contact to submit commands.
retain_status_information: This directive is used to determine whether or not status-related information about the contact is retained across program restarts. This is only useful if you have enabled state retention using the retain_state_information directive. Value: 0 = disable status information retention, 1 = enable status information retention.
retain_nonstatus_information: This directive is used to determine whether or not non-status information about the contact is retained across program restarts. This is only useful if you have enabled state retention using the retain_state_information directive. Value: 0 = disable non-status information retention, 1 = enable non-status information retention.
描述:
A contact group definition is used to group one or more contacts together for the purpose of sending out alert/recovery notifications.
定义格式:
注意
标记了(*)的域是必备的而黑色是可选的。
define contactgroup{
		contactgroup_name       contactgroup_name(*)
		alias       alias(*)
		members       contacts(*)
		contactgroup_members       contactgroups
		...
		}
定义样例:
define contactgroup{
		contactgroup_name		novell-admins
		alias			Novell Administrators
		members			jdoe,rtobert,tzach
		}
域描述:
contactgroup_name: This directive is a short name used to identify the contact group.
alias: This directive is used to define a longer name or description used to identify the contact group.
members: This directive is used to define a list of the short names of contacts that should be included in this group. Multiple contact names should be separated by commas. This directive may be used as an alternative to (or in addition to) using the contactgroups directive in contact definitions.
contactgroup_members: This optional directive can be used to include contacts from other "sub" contact groups in this contact group. Specify a comma-delimited list of short names of other contact groups whose members should be included in this group.
描述:
A time period is a list of times during various days that are considered to be "valid" times for notifications and service checks. It consists of time ranges for each day of the week that "rotate" once the week has come to an end. Different types of exceptions to the normal weekly time are supported, including: specific weekdays, days of generic months, days of specific months, and calendar dates.
定义格式:
注意
标记了(*)的域是必备的而黑色是可选的。
define timeperiod{
		timeperiod_name       timeperiod_name(*)
		alias       alias(*)
		[weekday]       timeranges
		[exception]       timeranges
		exclude       [timeperiod1,timeperiod2,...,timeperiodn]
		...
		}
定义样例:
define timeperiod{
		timeperiod_name		nonworkhours
		alias			Non-Work Hours
		sunday			00:00-24:00			; Every Sunday of every week
		monday			00:00-09:00,17:00-24:00		; Every Monday of every week
		tuesday			00:00-09:00,17:00-24:00		; Every Tuesday of every week
		wednesday			00:00-09:00,17:00-24:00		; Every Wednesday of every week
		thursday			00:00-09:00,17:00-24:00		; Every Thursday of every week
		friday			00:00-09:00,17:00-24:00		; Every Friday of every week
		saturday			00:00-24:00			; Every Saturday of every week
		}

define timeperiod{
		timeperiod_name		misc-single-days
		alias			Misc Single Days
		1999-01-28		00:00-24:00 		; January 28th, 1999
		monday 3			00:00-24:00		; 3rd Monday of every month
		day 2			00:00-24:00		; 2nd day of every month
		february 10		00:00-24:00		; February 10th of every year
		february -1		00:00-24:00		; Last day in February of every year
		friday -2			00:00-24:00		; 2nd to last Friday of every month
		thursday -1 november	00:00-24:00		; Last Thursday in November of every year
		}

define timeperiod{
		timeperiod_name		misc-date-ranges
		alias			Misc Date Ranges
		2007-01-01 - 2008-02-01	00:00-24:00		; January 1st, 2007 to February 1st, 2008
		monday 3 - thursday 4	00:00-24:00		; 3rd Monday to 4th Thursday of every month
		day 1 - 15		00:00-24:00		; 1st to 15th day of every month
		day 20 - -1		00:00-24:00		; 20th to the last day of every month
		july 10 - 15		00:00-24:00		; July 10th to July 15th of every year
		april 10 - may 15		00:00-24:00		; April 10th to May 15th of every year
		tuesday 1 april - friday 2 may	00:00-24:00	; 1st Tuesday in April to 2nd Friday in May of every year
		}

define timeperiod{
		timeperiod_name		misc-skip-ranges
		alias			Misc Skip Ranges
		2007-01-01 - 2008-02-01 / 3		00:00-24:00	; Every 3 days from January 1st, 2007 to February 1st, 2008
		2008-04-01 / 7			00:00-24:00	; Every 7 days from April 1st, 2008 (continuing forever)
		monday 3 - thursday 4 / 2		00:00-24:00	; Every other day from 3rd Monday to 4th Thursday of every month
		day 1 - 15 / 5			00:00-24:00	; Every 5 days from the 1st to the 15th day of every month
		july 10 - 15 / 2			00:00-24:00	; Every other day from July 10th to July 15th of every year
		tuesday 1 april - friday 2 may / 6	00:00-24:00	; Every 6 days from the 1st Tuesday in April to the 2nd Friday in May of every year
		}
域描述:
timeperiod_name: This directives is the short name used to identify the time period.
alias: This directive is a longer name or description used to identify the time period.
[weekday]: The weekday directives ("sunday" through "saturday")are comma-delimited lists of time ranges that are "valid" times for a particular day of the week. Notice that there are seven different days for which you can define time ranges (Sunday through Saturday). Each time range is in the form of HH:MM-HH:MM, where hours are specified on a 24 hour clock. For programlisting, 00:15-24:00 means 12:15am in the morning for this day until 12:20am midnight (a 23 hour, 45 minute total time range). If you wish to exclude an entire day from the timeperiod, simply do not include it in the timeperiod definition.
[exception]:
exclude: This directive is used to specify the short names of other timeperiod definitions whose time ranges should be excluded from this timeperiod. Multiple timeperiod names should be separated with a comma.
描述:
A command definition is just that. It defines a command. Commands that can be defined include service checks, service notifications, service event handlers, host checks, host notifications, and host event handlers. Command definitions can contain macros, but you must make sure that you include only those macros that are "valid" for the circumstances when the command will be used. More information on what macros are available and when they are "valid" can be found here. The different arguments to a command definition are outlined below.
定义格式:
注意
标记了(*)的域是必备的而黑色是可选的。
define command{
		command_name       command_name(*)
		command_line       command_line(*)
		...
		}
定义样例:
define command{
		command_name	check_pop
		command_line	/usr/local/nagios/libexec/check_pop -H $HOSTADDRESS$
		}
域描述:
command_name: This directive is the short name used to identify the command. It is referenced in contact, host, and service definitions (in notification, check, and event handler directives), among other places.
command_line:
描述:
Service dependencies are an advanced feature of Nagios that allow you to suppress notifications and active checks of services based on the status of one or more other services. Service dependencies are optional and are mainly targeted at advanced users who have complicated monitoring setups. More information on how service dependencies work (read this!) can be found here.
定义格式:
注意
标记了(*)的域是必备的而黑色是可选的。然而你最少要在定义中给定出一种使用类型标准。
define servicedependency{
		dependent_host_name       host_name(*)
		dependent_hostgroup_name       hostgroup_name
		dependent_service_description       service_description(*)
		host_name       host_name(*)
		hostgroup_name       hostgroup_name
		service_description       service_description(*)
		inherits_parent       [0/1]
		execution_failure_criteria       [o,w,u,c,p,n]
		notification_failure_criteria       [o,w,u,c,p,n]
		dependency_period       timeperiod_name
		...
		}
定义样例:
define servicedependency{
		host_name			WWW1
		service_description		Apache Web Server
		dependent_host_name		WWW1
		dependent_service_description	Main Web Site
		execution_failure_criteria	n
		notification_failure_criteria	w,u,c
		}
域描述:
dependent_host: This directive is used to identify the short name(s) of the host(s) that the dependent service "runs" on or is associated with. Multiple hosts should be separated by commas. Leaving is directive blank can be used to create "same host" dependencies.
dependent_hostgroup: This directive is used to specify the short name(s) of the hostgroup(s) that the dependent service "runs" on or is associated with. Multiple hostgroups should be separated by commas. The dependent_hostgroup may be used instead of, or in addition to, the dependent_host directive.
dependent_service_description: This directive is used to identify the description of the dependentservice.
host_name: This directive is used to identify the short name(s) of the host(s) that the service that is being depended upon (also referred to as the master service) "runs" on or is associated with. Multiple hosts should be separated by commas.
hostgroup_name: This directive is used to identify the short name(s) of the hostgroup(s) that the service that is being depended upon (also referred to as the master service) "runs" on or is associated with. Multiple hostgroups should be separated by commas. The hostgroup_name may be used instead of, or in addition to, the host_name directive.
service_description: This directive is used to identify the description of the servicethat is being depended upon (also referred to as the master service).
inherits_parent: This directive indicates whether or not the dependency inherits dependencies of the service that is being depended upon (also referred to as the master service). In other words, if the master service is dependent upon other services and any one of those dependencies fail, this dependency will also fail.
execution_failure_criteria: This directive is used to specify the criteria that determine when the dependent service should not be actively checked. If the master service is in one of the failure states we specify, the dependent service will not be actively checked. Valid options are a combination of one or more of the following (multiple options are separated with commas): o = fail on an OK state, w = fail on a WARNING state, u = fail on an UNKNOWN state, c = fail on a CRITICAL state, and p = fail on a pending state (e.g. the service has not yet been checked). If you specify n (none) as an option, the execution dependency will never fail and checks of the dependent service will always be actively checked (if other conditions allow for it to be). Example: If you specify o,c,u in this field, the dependent service will not be actively checked if the master service is in either an OK, a CRITICAL, or an UNKNOWN state.
notification_failure_criteria: This directive is used to define the criteria that determine when notifications for the dependent service should not be sent out. If the master service is in one of the failure states we specify, notifications for the dependent service will not be sent to contacts. Valid options are a combination of one or more of the following: o = fail on an OK state, w = fail on a WARNING state, u = fail on an UNKNOWN state, c = fail on a CRITICAL state, and p = fail on a pending state (e.g. the service has not yet been checked). If you specify n (none) as an option, the notification dependency will never fail and notifications for the dependent service will always be sent out. Example: If you specify w in this field, the notifications for the dependent service will not be sent out if the master service is in a WARNING state.
dependency_period: This directive is used to specify the short name of the time period during which this dependency is valid. If this directive is not specified, the dependency is considered to be valid during all times.
描述:
Service escalations are completely optional and are used to escalate notifications for a particular service. More information on how notification escalations work can be found here.
定义格式:
注意
标记了(*)的域是必备的而黑色是可选的。
define serviceescalation{
		host_name       host_name(*)
		hostgroup_name       hostgroup_name
		service_description       service_description(*)
		contacts       contacts(*)
		contact_groups       contactgroup_name(*)
		first_notification       #(*)
		last_notification       #(*)
		notification_interval       #(*)
		escalation_period       timeperiod_name
		escalation_options       [w,u,c,r]
		...
		}
定义样例:
define serviceescalation{
		host_name		nt-3
		service_description	Processor Load
		first_notification	4
		last_notification	0
		notification_interval	30
		contact_groups		all-nt-admins,themanagers
		}
域描述:
host_name: This directive is used to identify the short name(s) of the host(s) that the service escalation should apply to or is associated with.
hostgroup_name: This directive is used to specify the short name(s) of the hostgroup(s) that the service escalation should apply to or is associated with. Multiple hostgroups should be separated by commas. The hostgroup_name may be used instead of, or in addition to, the host_name directive.
service_description: This directive is used to identify the description of the service the escalation should apply to.
first_notification: This directive is a number that identifies the first notification for which this escalation is effective. For instance, if you set this value to 3, this escalation will only be used if the service is in a non-OK state long enough for a third notification to go out.
last_notification: This directive is a number that identifies the last notification for which this escalation is effective. For instance, if you set this value to 5, this escalation will not be used if more than five notifications are sent out for the service. Setting this value to 0 means to keep using this escalation entry forever (no matter how many notifications go out).
contacts: This is a list of the short names of the contacts that should be notified whenever there are problems (or recoveries) with this service. Multiple contacts should be separated by commas. Useful if you want notifications to go to just a few people and don't want to configure contact groups. You must specify at least one contact or contact group in each service escalation definition.
contact_groups: This directive is used to identify the short name of the contact group that should be notified when the service notification is escalated. Multiple contact groups should be separated by commas. You must specify at least one contact or contact group in each service escalation definition.
notification_interval: This directive is used to determine the interval at which notifications should be made while this escalation is valid. If you specify a value of 0 for the interval, Nagios will send the first notification when this escalation definition is valid, but will then prevent any more problem notifications from being sent out for the host. Notifications are sent out again until the host recovers. This is useful if you want to stop having notifications sent out after a certain amount of time. Note: If multiple escalation entries for a host overlap for one or more notification ranges, the smallest notification interval from all escalation entries is used.
escalation_period: This directive is used to specify the short name of the time period during which this escalation is valid. If this directive is not specified, the escalation is considered to be valid during all times.
escalation_options: This directive is used to define the criteria that determine when this service escalation is used. The escalation is used only if the service is in one of the states specified in this directive. If this directive is not specified in a service escalation, the escalation is considered to be valid during all service states. Valid options are a combination of one or more of the following: r = escalate on an OK (recovery) state, w = escalate on a WARNING state, u = escalate on an UNKNOWN state, and c = escalate on a CRITICAL state. Example: If you specify w in this field, the escalation will only be used if the service is in a WARNING state.
描述:
Host dependencies are an advanced feature of Nagios that allow you to suppress notifications for hosts based on the status of one or more other hosts. Host dependencies are optional and are mainly targeted at advanced users who have complicated monitoring setups. More information on how host dependencies work (read this!) can be found here.
定义格式:
注意
标记了(*)的域是必备的而黑色是可选的。
define hostdependency{
		dependent_host_name       host_name(*)
		dependent_hostgroup_name       hostgroup_name
		host_name       host_name(*)
		hostgroup_name       hostgroup_name
		inherits_parent       [0/1]
		execution_failure_criteria       [o,d,u,p,n]
		notification_failure_criteria       [o,d,u,p,n]
		dependency_period       timeperiod_name
		...
		}
定义样例:
define hostdependency{
		host_name			WWW1
		dependent_host_name		DBASE1
		notification_failure_criteria	d,u
		}
域描述:
dependent_host_name: This directive is used to identify the short name(s) of the dependenthost(s). Multiple hosts should be separated by commas.
dependent_hostgroup_name: This directive is used to identify the short name(s) of the dependenthostgroup(s). Multiple hostgroups should be separated by commas. The dependent_hostgroup_name may be used instead of, or in addition to, the dependent_host_name directive.
host_name: This directive is used to identify the short name(s) of the host(s)that is being depended upon (also referred to as the master host). Multiple hosts should be separated by commas.
hostgroup_name: This directive is used to identify the short name(s) of the hostgroup(s)that is being depended upon (also referred to as the master host). Multiple hostgroups should be separated by commas. The hostgroup_name may be used instead of, or in addition to, the host_name directive.
inherits_parent: This directive indicates whether or not the dependency inherits dependencies of the host that is being depended upon (also referred to as the master host). In other words, if the master host is dependent upon other hosts and any one of those dependencies fail, this dependency will also fail.
execution_failure_criteria: This directive is used to specify the criteria that determine when the dependent host should not be actively checked. If the master host is in one of the failure states we specify, the dependent host will not be actively checked. Valid options are a combination of one or more of the following (multiple options are separated with commas): o = fail on an UP state, d = fail on a DOWN state, u = fail on an UNREACHABLE state, and p = fail on a pending state (e.g. the host has not yet been checked). If you specify n (none) as an option, the execution dependency will never fail and the dependent host will always be actively checked (if other conditions allow for it to be). Example: If you specify u,d in this field, the dependent host will not be actively checked if the master host is in either an UNREACHABLE or DOWN state.
notification_failure_criteria: This directive is used to define the criteria that determine when notifications for the dependent host should not be sent out. If the master host is in one of the failure states we specify, notifications for the dependent host will not be sent to contacts. Valid options are a combination of one or more of the following: o = fail on an UP state, d = fail on a DOWN state, u = fail on an UNREACHABLE state, and p = fail on a pending state (e.g. the host has not yet been checked). If you specify n (none) as an option, the notification dependency will never fail and notifications for the dependent host will always be sent out. Example: If you specify d in this field, the notifications for the dependent host will not be sent out if the master host is in a DOWN state.
dependency_period: This directive is used to specify the short name of the time period during which this dependency is valid. If this directive is not specified, the dependency is considered to be valid during all times.
描述:
Host escalations are completely optional and are used to escalate notifications for a particular host. More information on how notification escalations work can be found here.
定义格式:
注意
标记了(*)的域是必备的而黑色是可选的。
define hostescalation{
		host_name       host_name(*)
		hostgroup_name       hostgroup_name
		contacts       contacts(*)
		contact_groups       contactgroup_name(*)
		first_notification       #(*)
		last_notification       #(*)
		notification_interval       #(*)
		escalation_period       timeperiod_name
		escalation_options       [d,u,r]
		...
		}
定义样例:
define hostescalation{
		host_name		router-34
		first_notification	5
		last_notification	8
		notification_interval	60
		contact_groups		all-router-admins
		}
域描述:
host_name: This directive is used to identify the short name of the host that the escalation should apply to.
hostgroup_name: This directive is used to identify the short name(s) of the hostgroup(s) that the escalation should apply to. Multiple hostgroups should be separated by commas. If this is used, the escalation will apply to all hosts that are members of the specified hostgroup(s).
first_notification: This directive is a number that identifies the first notification for which this escalation is effective. For instance, if you set this value to 3, this escalation will only be used if the host is down or unreachable long enough for a third notification to go out.
last_notification: This directive is a number that identifies the last notification for which this escalation is effective. For instance, if you set this value to 5, this escalation will not be used if more than five notifications are sent out for the host. Setting this value to 0 means to keep using this escalation entry forever (no matter how many notifications go out).
contacts: This is a list of the short names of the contacts that should be notified whenever there are problems (or recoveries) with this host. Multiple contacts should be separated by commas. Useful if you want notifications to go to just a few people and don't want to configure contact groups. You must specify at least one contact or contact group in each host escalation definition.
contact_groups: This directive is used to identify the short name of the contact group that should be notified when the host notification is escalated. Multiple contact groups should be separated by commas. You must specify at least one contact or contact group in each host escalation definition.
notification_interval: This directive is used to determine the interval at which notifications should be made while this escalation is valid. If you specify a value of 0 for the interval, Nagios will send the first notification when this escalation definition is valid, but will then prevent any more problem notifications from being sent out for the host. Notifications are sent out again until the host recovers. This is useful if you want to stop having notifications sent out after a certain amount of time. Note: If multiple escalation entries for a host overlap for one or more notification ranges, the smallest notification interval from all escalation entries is used.
escalation_period: This directive is used to specify the short name of the time period during which this escalation is valid. If this directive is not specified, the escalation is considered to be valid during all times.
escalation_options: This directive is used to define the criteria that determine when this host escalation is used. The escalation is used only if the host is in one of the states specified in this directive. If this directive is not specified in a host escalation, the escalation is considered to be valid during all host states. Valid options are a combination of one or more of the following: r = escalate on an UP (recovery) state, d = escalate on a DOWN state, and u = escalate on an UNREACHABLE state. Example: If you specify d in this field, the escalation will only be used if the host is in a DOWN state.
描述:
Extended host information entries are basically used to make the output from the status, statusmap, statuswrl, and extinfo CGIs look pretty. They have no effect on monitoring and are completely optional.
Tip: As of Nagios 3.x, all directives contained in extended host information definitions are also available in host definitions. Thus, you can choose to define the directives below in your host definitions if it makes your configuration simpler. Separate extended host information definitions will continue to be supported for backward compatability.
定义格式:
注意
标记了(*)的域是必备的而黑色是可选的。然而你在定义里至少要提供一种可选域以使其有用。
define hostextinfo{
		host_name       host_name(*)
		notes       note_string
		notes_url       url
		action_url       url
		icon_image       image_file
		icon_image_alt       alt_string
		vrml_image       image_file
		statusmap_image       image_file
		2d_coords       x_coord,y_coord
		3d_coords       x_coord,y_coord,z_coord
		...
		}
定义样例:
define hostextinfo{
		host_name	netware1
		notes		This is the primary Netware file server
		notes_url	http://webserver.localhost.localdomain/hostinfo.pl?host=netware1
		icon_image	novell40.png
		icon_image_alt	IntranetWare 4.11
		vrml_image	novell40.png
		statusmap_image	novell40.gd2
		2d_coords	100,250
		3d_coords	100.0,50.0,75.0
		}
Variable Descriptions:
host_name: This variable is used to identify the short name of the host which the data is associated with.
notes: This directive is used to define an optional string of notes pertaining to the host. If you specify a note here, you will see the it in the extended information CGI (when you are viewing information about the specified host).
notes_url: This variable is used to define an optional URL that can be used to provide more information about the host. If you specify an URL, you will see a link that says "Extra Host Notes" in the extended information CGI (when you are viewing information about the specified host). Any valid URL can be used. If you plan on using relative paths, the base path will the the same as what is used to access the CGIs (i.e. /cgi-bin/nagios/). This can be very useful if you want to make detailed information on the host, emergency contact methods, etc. available to other support staff.
action_url: This directive is used to define an optional URL that can be used to provide more actions to be performed on the host. If you specify an URL, you will see a link that says "Extra Host Actions" in the extended information CGI (when you are viewing information about the specified host). Any valid URL can be used. If you plan on using relative paths, the base path will the the same as what is used to access the CGIs (i.e. /cgi-bin/nagios/).
icon_image: This variable is used to define the name of a GIF, PNG, or JPG image that should be associated with this host. This image will be displayed in the status and extended information CGIs. The image will look best if it is 40x40 pixels in size. Images for hosts are assumed to be in the logos/ subdirectory in your HTML images directory (i.e. /usr/local/nagios/share/images/logos).
icon_image_alt: This variable is used to define an optional string that is used in the ALT tag of the image specified by the <icon_image> argument. The ALT tag is used in the status, extended information and statusmap CGIs.
vrml_image: This variable is used to define the name of a GIF, PNG, or JPG image that should be associated with this host. This image will be used as the texture map for the specified host in the statuswrl CGI. Unlike the image you use for the <icon_image> variable, this one should probably not have any transparency. If it does, the host object will look a bit wierd. Images for hosts are assumed to be in the logos/ subdirectory in your HTML images directory (i.e. /usr/local/nagios/share/images/logos).
statusmap_image: This variable is used to define the name of an image that should be associated with this host in the statusmap CGI. You can specify a JPEG, PNG, and GIF image if you want, although I would strongly suggest using a GD2 format image, as other image formats will result in a lot of wasted CPU time when the statusmap image is generated. GD2 images can be created from PNG images by using the pngtogd2 utility supplied with Thomas Boutell's gd library. The GD2 images should be created in uncompressed format in order to minimize CPU load when the statusmap CGI is generating the network map image. The image will look best if it is 40x40 pixels in size. You can leave these option blank if you are not using the statusmap CGI. Images for hosts are assumed to be in the logos/ subdirectory in your HTML images directory (i.e. /usr/local/nagios/share/images/logos).
2d_coords: This variable is used to define coordinates to use when drawing the host in the statusmap CGI. Coordinates should be given in positive integers, as the correspond to physical pixels in the generated image. The origin for drawing (0,0) is in the upper left hand corner of the image and extends in the positive x direction (to the right) along the top of the image and in the positive y direction (down) along the left hand side of the image. For reference, the size of the icons drawn is usually about 40x40 pixels (text takes a little extra space). The coordinates you specify here are for the upper left hand corner of the host icon that is drawn. Note: Don't worry about what the maximum x and y coordinates that you can use are. The CGI will automatically calculate the maximum dimensions of the image it creates based on the largest x and y coordinates you specify.
3d_coords: This variable is used to define coordinates to use when drawing the host in the statuswrl CGI. Coordinates can be positive or negative real numbers. The origin for drawing is (0.0,0.0,0.0). For reference, the size of the host cubes drawn is 0.5 units on each side (text takes a little more space). The coordinates you specify here are used as the center of the host cube.
描述:
Extended service information entries are basically used to make the output from the status and extinfo CGIs look pretty. They have no effect on monitoring and are completely optional.
Tip: As of Nagios 3.x, all directives contained in extended service information definitions are also available in service definitions. Thus, you can choose to define the directives below in your service definitions if it makes your configuration simpler. Separate extended service information definitions will continue to be supported for backward compatability.
定义格式:
注意
标记了(*)的域是必备的而黑色是可选的。然而你在定义里至少要提供一个可选域以使其有用。
define serviceextinfo{
		host_name       host_name(*)
		service_description       service_description(*)
		notes       note_string
		notes_url       url
		action_url       url
		icon_image       image_file
		icon_image_alt       alt_string
		...
		}
定义样例:
define serviceextinfo{
		host_name		linux2
		service_description	Log Anomalies
		notes			Security-related log anomalies on secondary Linux server
		notes_url		http://webserver.localhost.localdomain/serviceinfo.pl?host=linux2&service=Log+Anomalies
		icon_image		security.png
		icon_image_alt		Security-Related Alerts
		}
Variable Descriptions:
host_name: This directive is used to identify the short name of the host that the service is associated with.
service_description: This directive is description of the service which the data is associated with.
notes: This directive is used to define an optional string of notes pertaining to the service. If you specify a note here, you will see the it in the extended information CGI (when you are viewing information about the specified service).
notes_url: This directive is used to define an optional URL that can be used to provide more information about the service. If you specify an URL, you will see a link that says "Extra Service Notes" in the extended information CGI (when you are viewing information about the specified service). Any valid URL can be used. If you plan on using relative paths, the base path will the the same as what is used to access the CGIs (i.e. /cgi-bin/nagios/). This can be very useful if you want to make detailed information on the service, emergency contact methods, etc. available to other support staff.
action_url: This directive is used to define an optional URL that can be used to provide more actions to be performed on the service. If you specify an URL, you will see a link that says "Extra Service Actions" in the extended information CGI (when you are viewing information about the specified service). Any valid URL can be used. If you plan on using relative paths, the base path will the the same as what is used to access the CGIs (i.e. /cgi-bin/nagios/).
icon_image: This variable is used to define the name of a GIF, PNG, or JPG image that should be associated with this host. This image will be displayed in the status and extended information CGIs. The image will look best if it is 40x40 pixels in size. Images for hosts are assumed to be in the logos/ subdirectory in your HTML images directory (i.e. /usr/local/nagios/share/images/logos).
icon_image_alt: This variable is used to define an optional string that is used in the ALT tag of the image specified by the <icon_image> argument. The ALT tag is used in the status, extended information and statusmap CGIs.
或者是...“如何来让你保持清醒”
本文试图向你解释如何让你利用那些隐藏于基于模板的对象定义之后的东西。那么你要问怎么来干?几各对象定义可以让你指定多个主机名和主机组名,允许你“复制”主机或服务的对象定义。我将逐个地说明支持这种方式的每种对象。如下的这些对象支持所要的省时特性:
没有列出的对象类型(象时间范围、命令等)不支持以上特性我将作出说明。
下例中我将使用“标准”的对象名匹配式。如果你愿意,可以打开use_regexp_matching配置选项里的使能开关。默认情况下只是对象名里包含*,?,+或\..的作为正则式进行处理,如果你想让全部都认为是正则式,你应使能use_true_regexp_matching配置选项。正则式可以被用于如下例子中的对象内的域(主机名称、主机组名、服务名称和服务组名)。
注意
使用正则时一定要小心-你可能需要修改配置文件,有时一些指令你并不想真正地被理解为正则式只是看起来角,任何问题都变成了你应验证你配置文件的证明。
多个主机:如果你想在多个主机上创建同一个服务,你可以在多个主机的host_name定义中实现。如下的定义中将服务名称叫SOMESERVICE的绑定在主机名字叫HOST1到HOSTN的多个主机上。所有的名字叫SOMESERVICE的服务将是同一个(例如有同一个检测命令、最大检测次数、告警周期等)。
define service{
		host_name		HOST1,HOST2,HOST3,...,HOSTN
		service_description	SOMESERVICE
		other service directives
		...
		}
在多个主机组里的全部主机:如果你想将一个或多个主机组里的全部主机标定同一个服务,该怎么办?在服务定义里的主机组域hostgroup_name里指定一个或多个玉机组。下面的服务名叫SOMESERVICE的服务被指定在一系列主机组HOSTGROUP1到HOSTGROUPN。全部的名叫SOMESERVICE的服务将是同一个(例如有同样的检测命令、最大检测次数、告警周期等)。
define service{
		hostgroup_name		HOSTGROUP1,HOSTGROUP2,...,HOSTGROUPN
		service_description	SOMESERVICE
		other service directives
		...
		}
全部主机:如果你想对你配置文件里的全部主机指定同一个服务,你要在host_name域里使用通配符。下面将在配置文件里指定一个服务名叫SOMESERVICE的服务。全部的名叫SOMESERVICE的服务将是同一个(例如相同的检测命令、最大检测次数、告警周期等)。
define service{
		host_name		*
		service_description	SOMESERVICE
		other service directives
		...
		}
不包含主机:如果你想定义一个服务在许多个主机或主机上但不包含某几个主机时,可以在不包含的主机或主机组前加上!符号。
define service{
		host_name             HOST1,HOST2,!HOST3,!HOST4,...,HOSTN
		hostgroup_name                HOSTGROUP1,HOSTGROUP2,!HOSTGROUP3,!HOSTGROUP4,...,HOSTGROUPN
		service_description   SOMESERVICE
		other service directives
		...
		}
多个主机:如果想对多个主机上的服务或服务描述创建同一个服务扩展对象,你可以在多个主机上指定host_name域。如下在主机系列从HOST1到HOSTN上指定一个服务扩展对象到服务名为SOMESERVICE的服务,这些服务扩展将有同一个内容定义(如相同的联系人组、通知间隔等)。
define serviceescalation{
		host_name		HOST1,HOST2,HOST3,...,HOSTN
		service_description	SOMESERVICE
		other escalation directives
		...
		}
多个主机里的全部主机:如果想对一个或多个主机组里的全部主机上的服务定义同一个服务扩展,你可以使用hostgroup_name域。下面将在主机组系列从HOSTGROUP1到HOSTGROUPN上全部主机上的服务名是SOMESERVICE有同一个服务扩展。所有的服务扩展是同一的(如有相同的联系人组、通知间隔)。
define serviceescalation{
		hostgroup_name		HOSTGROUP1,HOSTGROUP2,...,HOSTGROUPN
		service_description	SOMESERVICE
		other escalation directives
		...
		}
全部主机:如果你想在你的配置文件里的全部主机上相同名称或描述的服务上创建同一个服务扩展,你需要在host_name域里用通配符。下面在配置文件里的全部主机上定义一个名为SOMESERVICE的服务有相同的服务扩展。全部的服务扩展是同一个(如有相同的联系人组、通知间隔等)。
define serviceescalation{
		host_name		*
		service_description	SOMESERVICE
		other escalation directives
		...
		}
不包含主机:如果你想定义一个服务扩展在许多个主机或主机但不包含某几个主机上的服务时,可以在不包含>的主机或主机组前加上!符号。
define serviceescalation{
		host_name             HOST1,HOST2,!HOST3,!HOST4,...,HOSTN
		hostgroup_name                HOSTGROUP1,HOSTGROUP2,!HOSTGROUP3,!HOSTGROUP4,...,HOSTGROUPN
		service_description   SOMESERVICE
		other escalation directives
		...
		}
一个主机上的全部服务:如果想对某个特别的主机上全部的服务创建同一个服务扩展,你可以在service_description域里使用通配符。下面在主机名是HOST1上的全部服务创建同一个服务扩展。如下的服务扩展将是同一个(如有相同的联系人组、通知间隔等)。
如果你特别喜欢急功冒进的话,你可以在host_name和service_description两个域里同时使用通配符。这样做将会创建一个你配置文件里的全部主机上的全部服务中定义同一个服务扩展。
define serviceescalation{
		host_name		HOST1
		service_description	*
		other escalation directives
		...
		}
同一个主机上的多个服务:如果对某个主机上的一个或多个服务创建同一个服务扩展,你可以在service_description域里指定服务描述。如下例中,在一主机名为HOST1上的一系列多个服务从SERVICE1到SERVICEN上创建服务扩展。所有的服务扩展是同一个(如有相同的联系人组、通知间隔等)。
define serviceescalation{
		host_name		HOST1
		service_description	SERVICE1,SERVICE2,...,SERVICEN
		other escalation directives
		...
		}
多个服务组里的全部服务:如果你想在一个或多个服务组里的全部服务创建同一个服务扩展,你可以用servicegroup_name域。如下将在一系列服务组自SERVICEGROUP1到SERVICEGROUPN的全部服务创建同一个服务扩展。这些服务扩展是同一个(如有相同的联系人组、通知间隔等)。
define serviceescalation{
		servicegroup_name		SERVICEGROUP1,SERVICEGROUP2,...,SERVICEGROUPN
		other escalation directives
		...
		}
多个主机:如果想在多个主机上创建同名或相同描述的服务依赖,你可以在多个主机定义里指定host_name或dependent_host_name域或是两者之一。在下例中,在主机HOST3和HOST4上的服务SERVICE2依赖于在HOST1 and HOST2主机上的SERVICE1服务。所有的主机服务依赖定义是相同的,除了主机名称(如有相同的通知故障处理等)。
define servicedependency{
		host_name			HOST1,HOST2
		service_description		SERVICE1
		dependent_host_name		HOST3,HOST4
		dependent_service_description	SERVICE2
		other dependency directives
		...
		}
多个主机组里的全部主机:如果你想在一个或多个主机组里的全部主机上创建一个同名或同描述的服务依赖,你可以指定hostgroup_name和dependent_hostgroup_name域或是两者之一。在下例中,主机组HOSTGROUP3和HOSTGROUP4里的全部主机上的服务SERVICE2将依赖于主机组HOSTGROUP1和HOSTGROUP2上的SERVICE1服务。假定每个主机组里有5个主机,那么这个定义将相当于创建了100个服务依赖!所有的服务依赖是相同的除了那些主机名有所不同(如有相同的通知故障处理等)。
define servicedependency{
		hostgroup_name			HOSTGROUP1,HOSTGROUP2
		service_description		SERVICE1
		dependent_hostgroup_name	HOSTGROUP3,HOSTGROUP4
		dependent_service_description	SERVICE2
		other dependency directives
		...
		}
一个主机上的全部服务:如果你想创建针对某个主机的全部服务上的服务依赖,你可以在service_description和dependent_service_description域里使用通配符或是两者之一中使用。在下例中,全部在主机HOST2上的服务依赖于主机HOST1上的全部服务。全部的服务依赖将是相同的(如有相同的通知故障处理等)。
define servicedependency{
		host_name			HOST1
		service_description		*
		dependent_host_name		HOST2
		dependent_service_description	*
		other dependency directives
		...
		}
一个主机上的多个服务:如果你想创建对某个主机上的多个服务的服务依赖,你可以在service_description和dependent_service_description域里写一个或多个服务描述,象这样:
define servicedependency{
		host_name			HOST1
		service_description		SERVICE1,SERVICE2,...,SERVICEN
		dependent_host_name		HOST2
		dependent_service_description	SERVICE1,SERVICE2,...,SERVICEN
		other dependency directives
		...
		}
多个服务组里的全部服务:如果你想在一个或多个服务组里的全部服务上创建服务领事,你可以用servicegroup_name和dependent_servicegroup_name域,象这样:
define servicedependency{
		servicegroup_name		SERVICEGROUP1,SERVICEGROUP2,...,SERVICEGROUPN
		dependent_servicegroup_name	SERVICEGROUP3,SERVICEGROUP4,...SERVICEGROUPN
		other dependency directives
		...
		}
相同主机的服务依赖:如果想在相同主机的服务上创建服务依赖,空着dependent_host_name和dependent_hostgroup_name域。如下的例子中中,主机HOST1和HOST2至少有四个服务绑定其上:SERVICE1、SERVICE2、SERVICE3和SERVICE4,在这个例子中,主机HOST1的SERVICE3和SERVICE4依赖于自身的SERVICE1和SERVICE2服务,相似的,HOST2主机上SERVICE3和SERVICE4服务依赖于自身的SERVICE1和SERVICE2服务。
define servicedependency{
		host_name			HOST1,HOST2
		service_description		SERVICE1,SERVICE2
		dependent_service_description	SERVICE3,SERVICE4
		other dependency directives
		...
		}
多个主机:如果你想对多个主机创建同一个主机扩展,你需要使用host_name域。如下将在一系列自HOST1到HOSTN的主机上创建同一的主机扩展。如下的主机扩展是同一个(如相同的联系人组、通知间隔等)。
define hostescalation{
		host_name		HOST1,HOST2,HOST3,...,HOSTN
		other escalation directives
		...
		}
多个主机组里的全部主机:如果想在一个或多个主机组里的全部主机上创建同一个主机扩展,你可以用hostgroup_name域。如下将在一系列自HOSTGROUP1到HOSTGROUPN的主机组里的全部主机上创建同一个主机扩展。如下的主机扩展是同一个(如有相同的联系人组、通知间隔等)。
define hostescalation{
		hostgroup_name		HOSTGROUP1,HOSTGROUP2,...,HOSTGROUPN
		other escalation directives
		...
		}
全部主机:如果你想对你配置文件里的全部主机创建同一个主机扩展,你可以在host_name域里使用通配符。如下将对你配置文件里的全部主机定义同一个主机扩展。全部的主机扩展是同一个(如有相同的联系人组、通知间隔等)。
define hostescalation{
		host_name		*
		other escalation directives
		...
		}
不包含主机:如果在一系列的主机和主机组但不包含某些主机上创建同一个主机扩展,可以在主机或主机组定义前加上!符号。
define hostescalation{
		host_name             HOST1,HOST2,!HOST3,!HOST4,...,HOSTN
		hostgroup_name                HOSTGROUP1,HOSTGROUP2,!HOSTGROUP3,!HOSTGROUP4,...,HOSTGROUPN
		other escalation directives
		...
		}
多个主机:如果想在多个主机上创建同一主机依赖,你可以使用host_name或dependent_host_name域或同时使用。如下定义将生成六个分离的主机依赖,主机HOST3、HOST4和HOST5将依赖于HOST1和HOST2。以上的主机依赖是同一个(如有相同的通知失效处理等)。
define hostdependency{
		host_name		HOST1,HOST2
		dependent_host_name	HOST3,HOST4,HOST5
		other dependency directives
		...
		}
多个主机组里的全部主机:如果对一个或多个主机组里的全部主机创建同一个主机依赖,你可以用hostgroup_name或dependent_hostgroup_name域或两个都用。在如下例中,主机组HOSTGROUP3和HOSTGROUP4里的全部主机依赖于主机组HOSTGROUP1和HOSTGROUP2的主机。如下的主机依赖同一个只是主机名不同(如有相同的通知失效处理等)。
define hostdependency{
		hostgroup_name			HOSTGROUP1,HOSTGROUP2
		dependent_hostgroup_name	HOSTGROUP3,HOSTGROUP4
		other dependency directives
		...
		}
用户通常想在主机、服务或联系人的对象里加入自已定制的变量,这些变量象SNMP共同体名、MAC地址、AIM用户名、Skype帐号和街道名称等等,可能有各种各样的东西无法列完。这样会使Nagios不具备通用性并且无法保持一个特定的架构。Nagios试图更为柔性化,这就意味着需要处理这种情况,例如在Nagios的主机对象定义中,"address"是一个IP地址也可以是任何东西,只要对使用者而言是个可读可操作的,无论用户怎么设置都行。
但还是有必要在Nagios配置文件中提供一种可供管理和保存的处理方法而不是与现有变量域混用的方法。Nagios试图在对象的定义中引用用户自定制变量来解决这个问题。用户自定制变量的方法可以让用户在主机、服务和联系人对象定义里加入属性,在通知、事件处理和对主机与服务的检测中使用这些变量。
使用用户自定制变量需要注意如下几个要点:
这有一个如何在对象中定义不同类型的用户自定制变量的例子:
define host{
		host_name	linuxserver
		_mac_address	00:06:5B:A6:AD:AA	; <-- Custom MAC_ADDRESS variable
		_rack_number	R32			; <-- Custom RACK_NUMBER variable
		...
		}
define service{
		host_name	linuxserver
		description	Memory Usage
		_SNMP_community	public			; <-- Custom SNMP_COMMUNITY variable
		_TechContact	Jane Doe		; <-- Custom TECHCONTACT variable
		...
		}
define contact{
		contact_name	john
		_AIM_username	john16			; <-- Custom AIM_USERNAME variable
		_YahooID	john32			; <-- Custom YAHOOID variable
		...
		}
在Nagios的检测、通知等的脚本和执行程序里可以引用用户自定制变量,通过使用宏或是环境变量来实现。
为防止混淆不同对象类型中的用户定制变量,Nagios在宏和环境变量的名字里,对用户定义的主机、服务或是联系人的变量名之前分别加上了"_HOST"、"_SERVICE"或"_CONTACT"以示区分。下面的表格中给出前面例子中的用户自定制变量在宏和环境变量这中的可引用的命名。
表 6.1.
| 对象类型 | 变量名 | 宏名 | 环境变量 |
|---|---|---|---|
| 主机 | MAC_ADDRESS | $_HOSTMAC_ADDRESS$ | NAGIOS__HOSTMAC_ADDRESS |
| 主机 | RACK_NUMBER | $_HOSTRACK_NUMBER$ | NAGIOS__HOSTRACK_NUMBER |
| 服务 | SNMP_COMMUNITY | $_SERVICESNMP_COMMUNITY$ | NAGIOS__SERVICESNMP_COMMUNITY |
| 服务 | TECHCONTACT | $_SERVICETECHCONTACT$ | NAGIOS__SERVICETECHCONTACT |
| 联系人 | AIM_USERNAME | $_CONTACTAIM_USERNAME$ | NAGIOS__CONTACTAIM_USERNAME |
| 联系人 | YAHOOID | $_CONTACTYAHOOID$ | NAGIOS__CONTACTYAHOOID |
象标准的主机、服务或联系人对象里的变量一样,用户自定制变量同样可以继承。
本文件试图解释什么是对象继承和如何在对象定义里使用它。
如果你在前过之后被如何进行递归和继承搞迷糊了,你可以看一下Nagios发行包里的简单的对象配置文件。如果还没有帮助,扔个邮件写清楚详细情况描述你的问题到nagios-users邮件列表。
对于全部的对象定义说明,有三个变量影响着递归和继承关系,下面用(*)符号标记说明:
define someobjecttype{
		object-specific variables ...
		name		template_name(*)
		use		name_of_template_to_use(*)
		register	[0/1](*)
		}
第一个变量是name,只是一个可供其他对象定义时提供模板引用名字,以使其他对象可以继承属性和变量。模板名字必须是唯一的且继承者要有相同的类型定义,也就是说,不能给主机对象定义有两个或以上的模板含有同一个主机模板。
第二个变量是use,用来表示对象的属性和变量是继承于哪个指定模板。指定的这个继承来源必须是一个命名过的另一个对象模板(用变量name确切命名过的)。
第三个变量是register。这个变量用于告知这个对象定义是否需要Nagios“注册”。默认情况下,对象定义是需要Nagios注册。如果你想利用一个对象定义的部分内容作为一个模板,你可以让它不在Nagios里注册(后面将提供一个例子)。取值:0 = 不做注册;1 = 注册(默认值)。这个变量是不被继承的;每个对象模板都须明确地将这个register变量设置为0。防止register被设置为1的继承后覆盖需要注册的对象定义。
在理解继承关系时有一个很重要就是本地的对象变量总是优先于模板里的对象变量值,看一下下面的例子中两个主机的定义(没有提供全部的必备变量):
define host{
		host_name		bighost1
		check_command		check-host-alive
		notification_options	d,u,r
		max_check_attempts	5
		name			hosttemplate1
		}
define host{
		host_name		bighost2
		max_check_attempts	3
		use			hosttemplate1
		}
你注意到主机bighost1的定义中引用了模板hosttemplate1定义,主机bighost2的定义则使用了主机bighost1作为模板。一旦由Nagios来处理这些数据,那么主机bighost2相当于是这么定义的:
define host{
		host_name		bighost2
		check_command		check-host-alive
		notification_options	d,u,r
		max_check_attempts	3
		}
可以看到check_command和notification_options变量从模板(也就是主机bighost1的定义)继承而来,而host_name和max_check_attempts没有从模板对象中继承,而被限定于本地变量。这应该是一个相当容易理解的概念。
对象可以从多层次地使用模板对象的属性和变量(儿子可以引用老爸的老爸的东西,但更象老爸),如下例:
define host{
		host_name		bighost1
		check_command		check-host-alive
		notification_options	d,u,r
		max_check_attempts	5
		name			hosttemplate1
		}
define host{
		host_name		bighost2
		max_check_attempts	3
		use			hosttemplate1
		name			hosttemplate2
		}
define host{
		host_name		bighost3
		use			hosttemplate2
		}
注意主机bighost3变量来自主机bighost2中定义,而其后是继承主机bighost1的内容。采用如此方式来处理配置数据,其结果就象下面的主机定义一样:
define host{
		host_name		bighost1
		check_command		check-host-alive
		notification_options	d,u,r
		max_check_attempts	5
		}
define host{
		host_name		bighost2
		check_command		check-host-alive
		notification_options	d,u,r
		max_check_attempts	3
		}
define host{
		host_name		bighost3
		check_command		check-host-alive
		notification_options	d,u,r
		max_check_attempts	3
		}
对于对象继承层次的深度没有限度(老爸的老爸的老爸的...没有尽头的),但你为了保持清楚的定义以便于维护的话可能需要减少继承的层次(别把老祖宗也抬出来,家谱没办法画啦!:-D )。
用定义不完整的对象定义来做对象模板给其他对象做继承源是可以的,“不完整”的对象意思是定义了对象不含全部内容的对象。使用不完整的对象来做模板这可能看起很奇怪,但却推荐你这么做,为什么呢?因为它可以定义一堆默认的对象属性给其他的对象用于继承(这就象介绍父子俩:老爸长得的五宫很端正...,儿子象他爸)。看下面的例子:
define host{
		check_command		check-host-alive
		notification_options	d,u,r
		max_check_attempts	5
		name			generichosttemplate
		register		0
		}
define host{
		host_name		bighost1
		address			192.168.1.3
		use			generichosthosttemplate
		}
define host{
		host_name		bighost2
		address			192.168.1.4
		use			generichosthosttemplate
		}
注意到第一个主机对象的定义是不完整的,因为它缺少了必须的host_name变量。我们不想定义这个host_name,因为它是一个通用的对象模板。为了防止它被Nagios理解为一个一般的主机,我们把register变量设置为0。
主机bighost1和bighost2的定义来自于通用对象模板的继承。我们只是选择性地覆盖了address变量定义。也就是说,这两个主机将有相同的属性,除了host_name和address变量不一样。在Nagios处理这个样例中的配置数据时将等同于做如下对象的定义:
define host{
		host_name		bighost1
		address			192.168.1.3
		check_command		check-host-alive
		notification_options	d,u,r
		max_check_attempts	5
		}
define host{
		host_name		bighost2
		address			192.168.1.4
		check_command		check-host-alive
		notification_options	d,u,r
		max_check_attempts	5
		}
不完整的对象定义的优势最少最少的一点就是你可以在对象定义的时候少打很多字母,同样,它也可以在你改变大量的主机的变量定义时减少你的痛苦。(--原作者无非是想让用户尽量在对象定义的时候用这种理性的表达方式,而不是一团数据的粘贴来做)
任何你想在主机、服务或联系人等的带有用户定制变量的模板定义将象标准的对象变量一样做对象继承的传递(介绍一对特殊的父子:老爸长得高过姚明,儿了也很高),象下面的例子:
define host{
		_customvar1		somevalue  	; <-- Custom host variable
		_snmp_community		public		; <-- Custom host variable
		name			generichosttemplate
		register		0
		}
define host{
		host_name		bighost1
		address			192.168.1.3
		use			generichosthosttemplate
		}
主机bighost1将会继承来自于模板generichosttemplate的用户定义变量_customvar1和_snmp_community和各自的值。其结果是主机bighost1的定义就象这样:
define host{
		host_name		bighost1
		address			192.168.1.3
		_customvar1		somevalue
		_snmp_community		public
		}
有些情况下,你并不想让你的主机、服务或联系人对象定义继承从模板里定义的值,在是这种情况下,你可以指定为"null"(是不带双引号的)做为变量的值以防止继承模板的值(介绍父子俩:老爸个子高过姚明,但儿子很普通,儿子多高还是不知道吧?!),如下面的例子:
define host{
		event_handler		my-event-handler-command
		name			generichosttemplate
		register		0
		}
define host{
		host_name		bighost1
		address			192.168.1.3
		event_handler		null
		use			generichosthosttemplate
		}
在上例中,主机bighost1的对象定义将不再继承event_handler变量,而这个变量是定义在模板generichosttemplate之中。其结果就是主机bighost1的定义是下面这样子:
define host{
		host_name		bighost1
		address			192.168.1.3
		}
Nagios在处理时总是让本地变量高于从模板继承,但有些时候想让本地变量与继承模板的对象同时起效。
这种“附加继承”式的继承可以是在本地变量中用一个附加(也就一个"+"号)式来表示它。但这种特性只支持标准(非用户定制)变量中包含这种串定义(介绍父子俩:老爸个子是二米一,儿子个子比老爸高出两公分)。如下面的例子:
define host{
		hostgroups		all-servers
		name			generichosttemplate
		register		0
		}
define host{
		host_name		linuxserver1
		hostgroups		+linux-servers,web-servers
		use			generichosthosttemplate
		}
在上面例子中,主机linuxserver1的本地变量hostgroups将会附加在由模板generichosttemplate的变量之上,其主机linuxserver1的结果就是:
define host{
		host_name		linuxserver1
		hostgroups		all-servers,linux-servers,web-servers
		}
通常情况下,你必须清晰地指定哪些对象的变量是从模板继承的,有很少的情况并不遵守这个规则,也就是当Nagios认为你想利用其中的一个值而不是从相关对象引用时是这样的。例如,如果你不指明晰地指定有些服务的变量将是从主机与服务的结合中获得。
下表中列举了这些情况。当你没有特别清晰地指定对象变量值并且没有可从模板继承的值的时候,下面列出的情况就会从相关对象里面引用从而实现隐含继承。
表 6.2.
| Object Type | Object Variable | Implied Source |
|---|---|---|
| 服务 | contact_groups | 绑定的主机对象中的contact_groups域 |
| notification_interval | 绑定的主机对象中的notification_interval域 | |
| notification_period | 绑定的主机对象中的notification_period域 | |
| 主机扩展 | contact_groups | 绑定的主机对象中的contact_groups域 |
| notification_interval | 绑定的主机对象中的notification_interval域 | |
| escalation_period | 绑定的主机对象中的notification_period域 | |
| 服务扩展 | contact_groups | 绑定的服务对象中的contact_groups域 |
| notification_interval | 绑定的服务对象中的notification_interval域 | |
| escalation_period | 绑定的服务对象中的notification_period域 |
服务扩展与服务扩展的对象定义可以将隐含继承和附加继承结合起来使用。如果对象扩展里不继承其他扩展对象模板中contact_groups或是contacts域的值,而且它contact_groups或contacts域里以(+)号开头,那么,主机或服务定义里的contact_groups或contacts域将使用附加继承逻辑的规则来处理。
搞迷糊了吧?这有个例子:
define host{
		name 		linux-server
		contact_groups	linux-admins
		...
		}
define hostescalation{
		host_name	linux-server
		contact_groups	+management
		...
		}
上面的例子相当于这样:
define hostescalation{
		host_name	linux-server
		contact_groups	linux-admins,management
		...
		}
(--如果你觉得这是个怪里怪气的规则,还是老老实实地写明白的好)
迄今为止,所有的例子都是从单一的源上来做对象定义时继承对象的变量或域值。你可以在一个复杂的配置里使用多个源来完成对象的变量或域值的定义。象下面的例子:
# Generic host template
define host{
		name 			generic-host
		active_checks_enabled	1
		check_interval		10
		...
		register 		0
		}
# Development web server template
define host{
		name 			development-server
		check_interval		15
		notification_options	d,u,r
		...
		register 		0
		}
# Development web server
define host{
		use			generic-host,development-server
		host_name 		devweb1
		...
		}
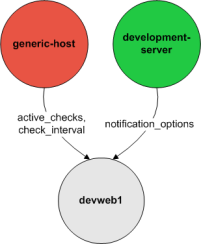
上例中,主机devweb1是从两个源模板generic-host和development-server中继承变量和域。要注意到check_interval域在两个源里都有定义。由于generic-host是第一个被主机devweb1的use域里说明的模板,那么它的check_interval域值将传给主机devweb1。那么这种继承规则下,主机devweb1将象如下的定义:
# Development web server
define host{
		host_name 		devweb1
		active_checks_enabled	1
		check_interval		10
		notification_options	d,u,r
		...
		}
当你使用多个源做继承时,告诉Nagios如何处理那些变量是很重要的事。一般是Nagios将会使用use域中指定的第一个对象模板(就是第一个源)。既然是可以从多个源里来继承变量或域值(--尤其是每个源都是多层次继承下来的时候),有必要清晰地处理这些变量和域的优先级别。
考虑如下的涉及到三个对象模板的主机定义:

# Development web server
define host{
		use 			1, 4, 8
		host_name		devweb1
		...
		}
如果从一个或多个模板中要继承而涉及到多个对象的引用时,优先级的处理方式是以右侧优先(--就是use中指明的第一个直接对象源1、直接源的父对象节点2、对象节点2的父对象3、第二个直接对象源4、源4的父节点5...依次类推,注意看图中的示意)。测试、检验和排错将有助于你更准确地理解象这种复杂的继承关系。(--老婆,跟我一块儿出来看上帝...)

可以用扩展信息CGI模块来对某主机或服务指定计划停机时间(可以在查看主机或服务信息时来做)。点击一下"给此主机/服务设置计划停机时间"的链接来开始编制一个计划停机时间。
一旦给主机与服务编制了一个计划停机时间,Nagios将会给主机与服务加入一条注释以说明在这个期间该主机与服务是处于计划停机时间内。当计划停机时间过去了,Nagios将自动地删除那条添加的注释。很棒吧?
当通过Web来编制一个主机与服务的计划停机时间时,Nagios会询问停机时间是固定式还是可变式,这里来解释一下“固定式”与“可变式”有何不同:
"固定式"停机时间启动和停止在你所编制计划所设定的时间内开始与结束,这当然很简单啦...
"可变式"停机时间可以用在当知道主机与服务要停机X分钟(或X小时)但是并不知道什么时候开始停机时,当使用可变式停机时间,Nagios将在某个时间开始执行停机,到你指定的时间间隔达到后结束停机。它假定了主机与服务使用一个可变的停机时间段来做停机时的操作,而这个停机时间段开始于主机进入宕机(或不可达)状态或是服务处于非正常状态时,结束时间是经过了你指定的时间间隔之后的那个时间点,即便是在此之前主机与服务已经恢复也是认为是它还处于停机时间内。对于这样的情况你将很需要这种停机时间定义,你需要做一个故障修复,但需要重启动机器才能让它真正启效。很聪明,不是么?
当编制主机与服务的停机时间时需要给出可对它“触发”的停机时间。什么是触发停机时间?有触发的停机时间开始于编制时所指定的停机时间开始的时刻,这对于很多个主机与服务的停机时间开始于编制好的某个停机时间条目时是非常有用的。比如,当编制一个主机的停机时间(因需要做维护而做停机)时,需要在网络拓扑中针对这个主机的全部子节点主机定制触发停机时间。
当主机与服务处于停机时间内时,Nagios将不会送出针对这个主机与服务的一般意义的通知。但是,会送出一条停机时间开始"DOWNTIMESTART"的通知,这将给主机与服务的管理者一个提示,在此之后将不会收到主机与服务故障时的告警通知直到停机时间结束。
当主机与服务的停机时间结束时,Nagios将再次可以送出针对这个主机与服务的一般意义的通知,也会送出一条停机时间结束"DOWNTIMEEND"的通知,这将给主机与服务的管理者提醒,在此之后会再次收到各种该有的通知了。
如果预置的停机时间被提前取消(在期满之前),会送出一条停机时间取消"DOWNTIMECANCELLED"的通知给相关的管理员。
这就好象是“天啊,它又没动静了。”的并发症,你知道我在说什么。你编制了一个服务停机时间来做“例行”的硬件升级,只是在此之后才意识到操作系统的驱动不支持它!硬盘RAID搞掉了或是驱动映像失败或是原始盘已经彻底完蛋了。象这样的故事会发生在任何一个你认为只是“例行”的停机时间里,而且相似的故事会一幕一幕地重演着。
看下面这个场景:你是个做网管的倒霉蛋,而且
- 你给主机A定制了停机时间是每周一晚上19:30-21:30;
- 通常大约是在周一晚上19:45时会开始硬件升级;
- 在一个很不幸日子里,你在浪费了一个半小时来处置SCSI和驱动不兼容之后,机器终于开启了;
- 在到了晚上21:15时,你才发现一个分区无法挂接或是在盘上怎么也找不到它;
- 知道要搞很长时间了,你不得不返回重编制对主机A编制一个额外停机时间,从周一晚上21:20到周二凌晨1:30;
如果你给主机与服务编制了重叠的计划停机时间(在上例中,有19:40到21:30和21:20到1:30两个停机时间)时,Nagios将会等待,直至最后一个编制的停机时间结束时才会送出相关的通知。在上例中,直到周二早晨的1:30之前的这段时间里,主机A的各种通知一直会被压制着。
或许是..."正当其时?"
时间周期对象定义可用于控制何时各种不同的监控与报警的逻辑可以执行或操作。例如可以限定:
- 何时可以执行对主机与服务的计划任务检测;
- 何时可以送出通知;
- 何时应用通知扩展;
- 何时依赖关系是正确的;
时间周期的对象定义中有多个不同类型的域,包括周计划、月计划、日历型日期。不同类型的域有不同的优先级别而且会覆盖同一个时间周期定义里的其他域值。不同类型的域的优先级从高到低依次如下(--后面是译者加的例子):
- 日历型日期(2008-01-01)--指定奥运会开幕的那天是(2008-08-08)
- 指定月份的日期(January 1st)--国庆是每年的十月一日-(October 1st)
- 一般月份里的日期(Day 15)--每个月的5号发工资啊(Day 5)
- 指定月份里的星期几的次数(2nd Tuesday in December)--父亲节是每年六月的第三个星期天(3th Sunday in June)
- 指定星期几的次数(3rd Monday)--每隔四周的周六都要执班(4rd Saturday)
- 一般的周计划(Tuesday)--每周六和周日都可以休息(Saturday Sunday)
不同的时间周期域的样例可以查阅这篇文档。
主机与服务定义里的可选域check_period可用于控制限定特定的时间周期,它可以用于控制何时进行规格化的计划任务,何时做自主检测等。
如果没有在check_period域来指定一个时间周期,Nagios将在任何需要的时候执行计划性的自主检测,实际上相当于设置一个24x7的时间周期。
Specifying a timeperiod in the在check_period域里指定一个时间周期可以限定Nagios执行规格化计划检测的时间,主机与服务自主检测的时间。当Nagios尝试去对主机或服务进行一个规格化计划表检测时,它将确保下次检测是在指定的合法时间段内进行。如果不是,Nagios将调整下次检测时间以使下次检测处于指定的时间周期所限定的合法时间内,这意味着主机或服务的检测可能在下个小时、下一天或下一周等等的时间里不会检测直至到时间。
注意
强烈建议你对全部的主机与服务使用24x7这个时间周期,除非你有一个明确的理由可以不这样做。如果没有用24x7,可能在你指定时间周期的的非合法时间里(无监控的黑色时间段)将会有些麻烦:
- 主机与服务的状态将不再改变;
- 联系人将几乎不会收到主机与服务的重置报警;
- 如果主机与服务从故障中恢复,所属的联系人将不会立即收到恢复的通知。
通过使用主机与服务对象定义里的notification_period域可以指定一个特定的时间周期,它可以限定Nagios主机与服务在认定故障或故障恢复时送出通知。当主机的通知将要被送出时,Nagios将会确保当前时刻处于notification_period指定的时间周期里是合法的时间。如果是合法时间,Nagios将尝试对每一个联系人送出故障与恢复的通知。
也可以用多种时间周期来控制通知送向不同的联系人。指定联系人对象定义里的service_notification_period和host_notification_period域,可以对每个联系人指定一个“按应需求”的时间周期。每个联系人将只是在指定的时间周期里才会收到主机与服务的通知。
如何创建一个“按应需求”循环的例子可以查阅这篇文档。
使用服务与主机的通知扩展对象定义里的可选项escalation_period域可以指定一个特定时间周期,它将限定在哪个时间内是扩展项是合法的且可用的。如果没有使用在扩展对象里的escalation_period域,那么扩展对象将认定所有时间都是合法时间。如果使用了escalation_period域来指定时间周期,Nagios将只是在指定时间周期所限定的合法时间内使用扩展对象。
通过使用主机与服务的依赖关系对象里的可选项dependency_period域来指定一个时间周期,它可以限定依赖关系对象在哪个时间段内是合法的且可以使用。如果没有在依赖关系对象里使用dependency_period域,依赖关系对象在任意时间里都是合法可用的。如果在对象依赖关系里的dependency_period域指定了时间周期,Nagios将只是在指定时间周期所限定盺合法时间内使用该依赖对象。
送出通知的判定是由主机与服务的检测逻辑来完成的。主机与服务的通知发生于如下情形:
- 当一个硬态状态变化时;更多有关状态类型与硬态变化的内容请查阅这篇文档。
- 当主机或服务仍旧处于一个硬态的非正常状态而且最后一次通知送出的时间超过了主机与服务对象定义里的<notification_interval>域所指定的时间时。
每个主机与服务对象定义里都有<contact_groups>域来指定接收此主机与服务通知内容的联系人组。联系人组可以包括一个或几个相互独立的联系人。
当Nagios送出主机与服务的通知,将会通知每个联系人组里的联系人成员,联系人组是由对象定义里的<contactgroups>域来设定。Nagios实现了联系人可以属于多个联系人组,所以会在做通知之前将联系人组里重复出现的联系人去掉保证每个联系人收到有且只有一次通知。
因为并非每一个接收送出通知的联系人都需要收到通知所以需要过滤器来处理它。通知送出前有好几个经过的过滤器,正因如此,指定有联系人就可能收不到信息因为过滤器可能把它要收到的信息组过滤掉了。下面稍详细点地介绍一下通知在送出前要通过的过滤器...
首先必须通过的过滤器是在程序里面内嵌是否发送通知的过滤器。它由主配置程序里的enable_notifications变量值初始化,但可在运行时通过Web接口改变它。如果通知在程序层面里是不使能的,那么在这期间里,不会送出任何主机与服务的通知。如果使能了它,仍旧有其他的过滤器要通过...
主机与服务通知要通过的第一个过滤器是检查主机与服务是否处于计划停机时间定义的时间段内。如果在停机时间段内,联系人不会收到通知。如果不是在停机时间段内,通知会通过这个过滤器而到下一个过滤。额外的提醒是,如果是在主机的停机时间段内,给主机上的服务通知将会被压制。
要通过的第二个过滤器是在检查主机与服务是否处于抖动(如果你使能了感知抖动检测项的话)。如果服务或主机当前处于抖动,联系人不会收到通知,其他情况下,这个过滤会通过进入到下个过滤器。
要通过的第三个过滤器是给主机的与服务的通知选项。每个服务对象定义含有一个选项过滤以决定是否在报警、紧急和恢复等状态时送出通知。相似的,主机对象定义里含有选项以决定是否在宕机、不可达和恢复等状态时送出通知。如果主机与服务的通知没有通过这些过滤选项,那么联系人不会收到通知,如果通过了,则会进入下一个过滤...注意,主机与服务的恢复通知仅仅是当诱发它的原始故障通知也送出时才会送出,这样就不会收到一条不知道原因的故障恢复通知的。
要通过的第四个过滤器是给时间周期的检查。每个主机与服务对象定义里都有一个<notification_period>通知时间周期选项来指定何时送出通知是合法的时间。如果送出通知的时间没有落在指定的时间周期所划定的范围内的话,没有人会收到通知。如果时间是处于指定的时间周期之内的话,该过滤会通过,则会进入一下个过滤...注意:如果时间周期的过滤器没有通过的,Nagios将会重新编制该主机与服务(如果它处于非正常状态的话)的通知送出时间,使送出时间处于合法的时间周期规定。这将有助于保证联系人在下一个时间周期到来时尽可能早地收到故障通知。
最后一个主机与服务的过滤器是由两个要素条件控制:(1)针对该主机与服务的已经送出的最后一条通知所发出的时间;(2)主机与服务在最后一条通知发出后仍旧处于相同的非正常状态所处的时间长度。如果遇到这两个限定条件,Nagios将会用最后一次通知送出时间到当前时间的时间段来比对主机与服务对象定义里的<notification_interval>通知间隔域,看看是否到达或超出。如果还没有到通知间隔所设置的时间段,不会送出通知给任何人。如果这个时间段已经超出了间隔设置而且第二个条件不成立的话(就是说因为状态不一样而送出通知),通知就会被送出!是否真正地送出通知,还必须要通过每个联系人的过滤器控制...
在这个点上,通知过程已经通过了程序过滤和全部的主机与服务对象里所设置的过滤,开始通知每一个它该通知到的联系人。这是否就意味着要每个联系人都会收到通知呢?并不是这样!每个联系人都有各自的联系人过滤器,通知要经过这些过滤后才能收到通知。注意:联系人过滤器指定给每一个联系人但不会影响到其他联系人是否收到通知。
第一个联系人过滤器是联系人对象定义里的有关主机的或服务的过滤通知选项。每个联系人可以指定出对于服务,是否要收到告警状态、紧急状态和恢复状态的通知,同样地,也可以指定针对主机是否要收到主机宕机、变为不达可或是恢复的通知。如果这些在联系人里的主机和服务的过滤没有通过的话就不会收到通知,如果设置了要送出通知,那么会进入下一个过滤器...注意:只是那些针对于主机与服务的原始故障而产生的通知才会送出,不会有人收到一个没有故障原因通知却有状态恢复的通知...
最后一个过滤是联系人里的时间周期设置的检查。每个联系人对象定义里的<notification_period>通知接收时间周期域指定了联系人可以接收通知的时间周期。如果通知的时间没有落入指定的时间周期的时间段内,联系人不会收到通知。如果在合法的时间段区间里,联系人会收到通知!
(译者注:数一数,一共有七个过滤器!第1个是总阀门,第2到第5个是针对服务与主机状态的,后面2个是针对每个联系人的,很复杂,但是提供了很大的控制度)
对于故障与恢复的通知方式,Nagios提供了多种供选择:BP机、蜂窝电话、电子邮件、即时信息、警报声音、电击(这是个什么东西?)等等。如何送出通知将依赖于你的对象定义文件里的通知命令。
注意
特定的通知方式(象BP机等)并没有直接融合在Nagios代码中因为这没有必要。Nagios的核心设计思想并不是把Nagios搞成一个集成完整统一的一个应用程序(all-in-one)。如果这种服务嵌入到Nagios的核心之中将会使得用户很难加入自己的检测方法,而且修改检测等等也不方便。通知的处理也是如此。有成百上千种方式来实现检测与通知,因而为何要舍近求远呢?最好的方式是提供一个外部调用的入口(如一个执行脚本或一个成熟的消息系统)来做这种杂事。有一些消息处理包或是蜂窝电话挂件的资源可以处理通知,在下面一节里给出了列表。
当编写通知命令时,需要理解是什么通知类型产生的。那个$NOTIFICATIONTYPE$宏将用一个字符串来指出是哪个类型。下表列出这个宏可能的值以及相关的描述信息:
表 6.3. 通知类型的宏
| 值 | 描述 |
|---|---|
| PROBLEM | 服务与主机刚刚(或是仍旧)处于故障状态。如果收到服务通知,可能服务是处于告警、未知或是紧急状态之中,如果收到是主机通知,主机可能是处于宕机或不可达状态之中 |
| RECOVERY | 服务与主机已经恢复。如果是一个服务通知,说明服务刚回到正常状态,如果是主机通知,说明主机刚刚回到运行状态 |
| ACKNOWLEDGEMENT | 这是一个主机与服务故障的确认通知。由联系人给特定的主机与服务通过Web来初始化一个确认通知 |
| FLAPPINGSTART | 主机与服务刚开始处于抖动 |
| FLAPPINGSTOP | 主机与服务刚结束抖动 |
| FLAPPINGDISABLED | 主机与服务刚因为检测抖动被关闭而停止抖动... |
| DOWNTIMESTART | 主机与服务刚进入到一个计划停机时间周期,在此后通知会被抑制 |
| DOWNTIMESTOP | 主机与服务刚结束了计划停机时间。有关故障的通知将恢复 |
| DOWNTIMECANCELLED | 给主机与服务所指定的计划停机时间刚刚取消。有关故障的通知将恢复 |
在Nagios中可以配置多种送出通知的方式。这取决于你所想用的方式方法。一旦安装好必须的支持软件并在配置文件里给定了通知命令就可以运用它们了。可行的方式这里只给出几种:
- 电子邮件(Email)
- BP机(Pager)
- 蜂窝电话短信息(CellPhone SMS)
- Windows弹出消息(WinPopup message)
- 各种即时信息(Yahoo, ICQ, or MSN instant message)
- 声音警报(Audio alerts)
- 等等...
所有这些全是基于你用通知命令格式来编写了一个命令行。
如果想找一个替代电子邮件送出通知的方法,如用BP机或蜂窝电话,查看一下如下软件包。这些可以与Nagios结合当故障产生时用一个Modem送出通知,这在EMail无法送出通知时起作用(注意,电子邮件在网络出现故障时可能不会送出电子邮件)我没有真正测试过这些包,但其他人报告说是可以用的...
- Gnokii一个手机短信的软件包(SMS software for contacting Nokia phones via GSM network)
- QuickPage数字BP机的软件(alphanumeric pager software)
- SendpageBP机软件(paging software)
- SMS Client给BP机或手机发短信的命令行工具(command line utility for sending messages to pagers and mobile phones)
如果想试验非传统的通知方式,比如说想费时费力地使用声音警报,在你的监控主机上使用合成声音来演绎出你的故障通知,可以迁出Festival项目,如果想用一个独立的声音报警盒子,可以迁出Network Audio System (NAS)和rplay项目。

事件处理是一些可选的系统命令(脚本或执行程序),一旦主机与服务的状态发生变化时就会运行它们。
一个明显的例子是使用事件处理来在任何人收到通知之前由Nagios来做一些前期故障修复。如下的情况也可能会用到:
- 重启动一个失效的服务;
- 往协助处置系统里敲入一个故障票;
- 把事件信息记录到数据库中;
- 循环操作主机电源*
- 等等
*循环操作主机电源是个故障处理经验,它是个不容易实现的自动化脚本。在用自动化脚本实现之前要考虑到它的后果。 :-)
有几种不同的事件处理类型可以用于主机与服务的状态变换的事件处理中:
- 全局主机事件处理
- 全局服务事件处理
- 特定主机事件处理
- 特定服务事件处理
全局主机和服务事件处理将于每一个主机和服务状态变更发生时候运行,且稍稍早于特定主机与服务的事件处理。可以用主配置文件里的global_host_event_handler和global_service_event_handler域来设置全局的主机与服务事件处理命令。
不同的主机与服务可以有各自不同事件处理来处置状态变化,是用主机和服务对象定义里的event_handler域来指定事件处理命令。这些设置的特定主机与服务的事件处理命令将会在全局主机与服务事件处理运行之后运行。
事件处理在程序层面上可通过主配置文件里的enable_event_handlers来控制打开或关闭。
特定主机的和服务的事件处理可用主机和服务对象里的event_handler_enabled域来开关。如果全局的enable_event_handlers域是关闭的,那么特定主机的和服务的事件处理也不会运行。
事件处理命令可以是SHELL或是Perl程序,同样可以是任意类型语言编写的在命令行下可执行的程序。至少脚本要处理在参数行里处理如下宏:
对服务的:$SERVICESTATE$、$SERVICESTATETYPE$和$SERVICEATTEMPT$;对主机的:$HOSTSTATE$、$HOSTSTATETYPE$和$HOSTATTEMPT$。
脚本须检测这些作为命令参数传入的值并采取任何必要动作来处理这些值。最好的理解事件处理如何工作的途径是看例子,幸运的是下面就提供个例子。
事件处理命令通常是与运行于本机上的Nagios程序的权限是相同的。这可能会有问题,如果你想写成一个用于系统服务重启的命令,它需要有root权限以执行一系列命令与任务。
较理想的是让事件处理拥有它将要执行的系统命令所需权限相同的权限。你或许尝试用sudo命令来实现它。
下面例子给出了监控本机上的HTTP服务且在HTTP服务对象里指定了restart-httpd来做为事件处理命令。同样地,假定已经设置了服务对象的max_check_attempts值为4或是大于4的值(服务将检测4次之后才认定它真的出问题)。该样例服务对象的定义片段象下面这样子:
define service{
	host_name			somehost
	service_description	HTTP
	max_check_attempts		4
	event_handler		restart-httpd
	...
	}
一旦对服务对象定义了事件处理,必须要保证命令可执行。一个restart-httpd命令的样例见下。注意在命令行里给命令脚本传递了几个宏-这个很重要!
define command{
	command_name	restart-httpd
	command_line	/usr/local/nagios/libexec/eventhandlers/restart-httpd  $SERVICESTATE$ $SERVICESTATETYPE$ $SERVICEATTEMPT$
	}
现在,写一个实现的事件处理脚本(它是/usr/local/nagios/libexec/eventhandlers/restart-httpd脚本文件的内容)。
#!/bin/sh
#
# Event handler script for restarting the web server on the local machine
#
# Note: This script will only restart the web server if the service is
#       retried 3 times (in a "soft" state) or if the web service somehow
#       manages to fall into a "hard" error state.
#
#
# What state is the HTTP service in?
case "$1" in
OK)
	# The service just came back up, so don't do anything...
	;;
WARNING)
	# We don't really care about warning states, since the service is probably still running...
	;;
UNKNOWN)
	# We don't know what might be causing an unknown error, so don't do anything...
	;;
CRITICAL)
	# Aha!  The HTTP service appears to have a problem - perhaps we should restart the server...
	# Is this a "soft" or a "hard" state?
	case "$2" in

	# We're in a "soft" state, meaning that Nagios is in the middle of retrying the
	# check before it turns into a "hard" state and contacts get notified...
	SOFT)

		# What check attempt are we on?  We don't want to restart the web server on the first
		# check, because it may just be a fluke!
		case "$3" in

		# Wait until the check has been tried 3 times before restarting the web server.
		# If the check fails on the 4th time (after we restart the web server), the state
		# type will turn to "hard" and contacts will be notified of the problem.
		# Hopefully this will restart the web server successfully, so the 4th check will
		# result in a "soft" recovery.  If that happens no one gets notified because we
		# fixed the problem!
		3)
			echo -n "Restarting HTTP service (3rd soft critical state)..."
			# Call the init script to restart the HTTPD server
			/etc/rc.d/init.d/httpd restart
			;;
			esac
		;;

	# The HTTP service somehow managed to turn into a hard error without getting fixed.
	# It should have been restarted by the code above, but for some reason it didn't.
	# Let's give it one last try, shall we?
	# Note: Contacts have already been notified of a problem with the service at this
	# point (unless you disabled notifications for this service)
	HARD)
		echo -n "Restarting HTTP service..."
		# Call the init script to restart the HTTPD server
		/etc/rc.d/init.d/httpd restart
		;;
	esac
	;;
esac
exit 0
样例脚本将尝试用两个时刻来重启本地Web服务:
- 在服务检测出三次并且是处于软态紧急状态之后;
- 在服务首次进入硬态紧急状态之后;
这个脚本理论上在服务转入硬态故障之前可以重启HTTP服务并可以修复故障,这里包含了首次重启没有成功的情况。须注意的是事件处理将只是第一次进入硬态紧急状态时才会执行事件处理,这将阻止Nagios在服务一直处于硬态故障的状态时会反复不停地重启动Web服务。你不需要反复地重启,对吧? :-)
这就是事件处理。事件处理很容易理解、编写和实现,所以要尽量尝试来使用并看看它能给你带来什么。
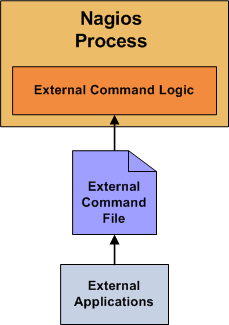
为使Nagios可以处理外部命令,必须按如下步骤来做:
- 使能了外部检测命令check_external_commands选项。
- 用command_check_interval选项设置了命令检测的频度。
- 在command_file选项中指定了命令文件的位置。
- 对包含有外部命令文件的目录给出了恰当的目录操作权限,象在快速指南说明的那样。
- 由command_check_interval选项指定了一个规格化的频度,该选项在主配置文件中给出。
- 在事件处理句柄之后被立即执行。在规格化定制周期执行的命令检测之后增加了如果需要Nagios来做事件处理之后立即执行的要求。
外部命令可以写入到命令文件之中,用如下格式:
[time] command_id;command_arguments
这里的time是指用time_t格式的时间戳,标记外部命令或应用执行时间。而command_id的值和command_arguments命令参数取决于Nagios将执行的命令。
一个完整的外部命令列表包括如何使用这些的样例可以在线查阅URL:
被监控的主机和服务的当前状态由如下两个要素决定:
- 主机与服务的状况(如正常、警告、运行和宕机等)
- 服务与主机将要从属的状态类型
Nagios有两种状态类型 - 软态和硬态。这两种状态取决于监控逻辑,当执行过事件处理或是当通知被初始送出时将会给出决定。
本文试图描述软态和硬太的状态区别,它们是如何发生及在发生时将做些什么。
为防止因瞬态故障而引发错误报警,Nagio需要定义主机与服务经过多少次的重试检测后再认为故障是“真正”发生。这个次数是由主机与服务中的max_check_attempts选项决定。理解如果真正故障发生时主机与服务进行检测重试的做法在理解状态类型机制很重要。
软态在如下情况时会发生:
- 当服务与主机检测返回一个非正常或非运行状态,同时,服务与主机的重试检测还没有达到设置max_check_attempts所设定的次数时。这个被称为软故障。
- 当服务与主机自软故障转变时。这个被称为软恢复。
软态变化时将有如下情形发生:
- 软态被记录;
- 事件处理将会执行以捕获分析软态;
只是在使能了主配置文件里的log_service_retries选项或是log_host_retries选项时软态才会被记录。
真正重要的是在软态发生时去执行事件处理。在它转入硬态之前应用事件处理将特别有效,如果你试图预处理修复故障时。当事件处理运行时,宏$HOSTSTATETYPE$或$SERVICESTATETYPE$将会赋值"软态",这样将使事件处理脚本得知什么时候正确动作。更多有关事件处理的信息可以查阅这篇文档。
主机与服务的硬态将会在如下情况发生:
- 当服务与主机检测返回一个非正常或非运行状态,同时,服务与主机的重试检测已经达到设置max_check_attempts所设定的次数时;这个被称为硬故障。
- 当主机与服务从一个硬故障转变为另一个时(如告警到紧急);
- 当服务检测处理非正常状态时对应的主机处于宕机或不可达时;
- 当主机或服务自一个硬态恢复时;这个被称为硬恢复。
- 当收到一个强制主机检测结果时。强制主机检测结果将被认定是硬态除非设置使能了passive_host_checks_are_soft选项;
当主机或服务经过硬态变迁时如下情形将会发生:
- 硬态被记录;
- 事件处理将会执行以处置硬态;
- 在主机与服务故障和恢复时对应的联系人将收到通知;
当执行事件处理时宏$HOSTSTATETYPE$或$SERVICESTATETYPE$将会赋值为"硬态",这样将使事件处理脚本得知什么时候正确动作。更多有关事件处理的信息可以查阅这篇文档。
这里有一个在当状态转换发生时和当事件处理与通知被送出时如何给定状态类型的例子。服务的最大重试次数max_check_attempts值设置为3。
表 6.4.
| 时刻 | 检测次数 | 状态 | 状态类型 | 是否状态变换 | 注释 |
|---|---|---|---|---|---|
| 0 | 1 | 正常 | 硬态 | 否 | 初始的服务状态 |
| 1 | 1 | 紧急 | 软态 | 是 | 首次发现非正常状态。执行事件处理。 |
| 2 | 2 | 告警 | 软态 | 是 | 服务仍处于非正常状态。执行事件处理。 |
| 3 | 3 | 紧急 | 硬态 | 是 | 达到最大重试次数,服务状态类型进入硬态。事件处理执行且送出故障通知。检测数在当时被重置为1。 |
| 4 | 1 | 告警 | 硬态 | 是 | 服务状态变换为硬态告警。事件处理执行且送出故障通知。 |
| 5 | 1 | 告警 | 硬态 | 否 | 服务仍停在硬态故障,为个取决于服务的通知间隔是多少,也可能会有另一个故障通知被送出。 |
| 6 | 1 | 正常 | 硬态 | 是 | 服务经历了一个硬态恢复。事件处理执行且一个恢复通知被送出。 |
| 7 | 1 | 正常 | 硬态 | 否 | 服务仍处于正常。 |
| 8 | 1 | 未知 | 软态 | 是 | 服务被检查出从一个软态非正常态变换了。事件处理执行。 |
| 9 | 2 | 正常 | 软态 | 是 | 服务经历了一个软恢复。事件处理执行,但通知不会送出,因为这不是个“真正”故障。当这发生时状态类型设置为硬态而且检测次数被立即重置为1。 |
| 10 | 1 | 正常 | 硬态 | 否 | 服务停在了一个正常状态。 |
由Nagios守护进程来做主机检测,一般是:
- 在规格化的间隔内,这个由主机对象定义里的check_interval和retry_interval选项确定;
- 当主机状态变换后对应的服务做按需检测;
- 在主机可达性逻辑中需要做按需检测;
- 在主机依赖检测的前处理中需要做按需检测;
规格化定期主机检测是可选的,如果你将主机对象定义里的check_interval值设置为0,Nagios将不会定期做检测。然而它仍旧会在按需检测时做主机检测,如果由监控逻辑中的其他部分需要进行检测时。
按需检测被用于当绑定于某台主机上的服务状态变换时对主机检测,因为Nagios需要知道主机是否也有状态变换情况发生。服务状态的变化通常表征着主机状态也发生变化。例如,如果Nagios发现某台主机上的HTTP服务从“紧急”到“正常”时,它有也表示主机刚刚从重启中恢复它重新恢复运行。
按需检测同样被用于主机可达性逻辑之中对主机检测。Nagios被设计为尽快地得到网络概况,且尽快分辨出主机的宕机与不可达状态。这些完全不同的状态将协助管理员尽快在网络中定位出问题源点。
按需检测同样在主机依赖性检测的前处理逻辑中进行主机检测。这将协助确保得到尽可能正确的依赖逻辑关系。
可用缓存检测来显著地改善按需检测的性能,缓存检测机制可使Nagios放弃一个主机的检测执行而使用相关的最近检测来替代,更多有关缓存检测的信息可查阅这篇文档。
计划式主机检测是并发运行的。当Nagios要运行一个计划的主机检测时,初始会对它进行主机检测返回后再然后做其他工作(运行服务检测等)。一个主机检测程序是由主Nagios守护进程fork派生出来的一个子进程。当主机检测完成,子进程将通告主进程检测的结果。Nagios主进程将处理检测结果并采取合适的动作(执行事件处理、发送通知等)。
如果需要按需主机检测同样可以并发。在前面所提及的,Nagios如果可以利用从缓存的相关的最近主机检测的结果而放弃一次按需检测。
当Nagios处理计划的和按需的主机检测结果时,它可能初始化之后的其他主机检测。初始化这些检测可能是由于两个原因:依赖性检测的前处理和使用网络可达性逻辑来判定主机状态。初始化的之后检测一般是并发的。然而,一个很大问题必须要把握,这将降低运行效率...
注意
在主机对象定义里将max_check_attempts值设定为1会导致一系列性能问题。原因就是,如果Nagios需要使用网络可达性逻辑来判定一个主机的真正状态(它们是宕机或不可达)时,Nagios将不得不对该主机的直接父节点执行一连续地检测。需要重申,这些检测是一个个地连续运行,而不是并发,这将导致性能降低。基于此,建议总是将主机对象定义里的max_check_attempts域值设置大于1。主机检测由插件来做,插件会返回结果,结果是运行、告警、未知和紧急四个状态之一。那么Nagios将如何把插件的返回值转换成主机的运行、宕机或不可达呢?下面会讲到。
下表给出了插件返回结果与预置主机状态,之后会做某些后续处理(后面会讲到),后续处理可能会改变最终的主机状态。
如果预置主机状态是宕机,Nagios将尝试它是否真的宕机还是它是不可达。宕机与不可达分开很重要,这使得管理员更快地查找到网络故障的源头。下面给出了基于该主机的父节点得出主机最终状态的表格。主机的父节点是在对象定义里的parents域来设定的。
表 6.6.
| 预置主机状态 | 父节点状态 | 最终的主机状态 |
|---|---|---|
| 宕机(DOWN) | 至少一台运行(UP) | 宕机(DOWN) |
| 宕机(DOWN) | 全部父节点不是宕机(DOWN)就是不可达(UNREACHABLE) | 不可达(UNREACHABLE) |
有关如何分辨宕机(DOWN)与不可达(UNREACHABLE)状态的更多信息可查阅这篇文档。
你可能注意到了主机并不总是留在一种状态,事件中断、打上补丁和服务器需要重启动等都会让它状态变换。当Nagios检测出主机状态时,它总是要感知到主机从四种状态之间做了变换并要采取对应的行动。这些在不同的状态类型(硬态或软态)下的状态变换将会触发事件处理的运行和发送出通知。发现与处置这些状态变换是Nagios该做的全部。
当主机状态过度频繁地变换状态时可以考虑状态处于“抖动”(flapping)。一个明显的例子就是一台主机由于加载操作系统而不断地重启动,这种状态就是处于抖动。不得不应对它是个有趣的方案,Nagios能感知主机开始抖动,并且可以压制通知直到抖动停下来达到一种稳定状态。更多的有关感知抖动逻辑的内容可以查阅这篇文档。
由Nagios守护进行的服务检测执行于
- 在规划的间隔到了时;间隔由服务对象定义里的check_interval和retry_interval选项确定。
- 因服务依赖检测的前处理需要而发出的按需检测;
因服务依赖检测的前处理逻辑而做的按需检测可以保证得到的依赖逻辑关系尽可能准确。如果不使用使用依赖,Nagios将不做任何按需服务检测。
通过应用缓存服务检测可以显著地改善按需服务检测的性能,缓存服务检测可令Nagios放弃一个服务检测而用一个相关的最近一个检测来替代。如果给出了服务依赖,缓存检测将只是提高性能。更多的有关缓存检测可查阅这篇文档。
计划的服务检测是并发运行。当Nagios需要运行一个计划服务检测时,它将初始化一个服务检测并返回来做其他工作(运行主机检测等)。服务检测在一个由Nagios守护主进程中派生出的子进程中运行,子进程将把检测结果通告给主进程。Nagios主程序会处理检测结果并采取合适的行动(执行一个事件处理、发出通知等)。
如果需要,按需服务检测同样可以并发。如前所述,Nagios可以放弃一个按需检测如果可以利用缓存的相关的最近的检测结果来替代的话。
由插件来做的服务检测将返回一个状态,是正常(OK)、告警(WARNING)、未知(UNKNOWN)或紧急(CRITICAL)四种之一。插件直接将转换为服务状态,如插件返回一个告警状态将使一个服务处于告警态。
Nagios用两种模式来对主机和服务进行检测:自主检测和被动检测。被动检测将在其他地方说明,这里只涉及自主检测。自主检测是最通用的监控主机与服务的方式。自主检测的主要特点是:
- 由Nagios进程进行起始的自主检测
- 自主检测是在一个规格化预定义周期之上进行
自主检测由Nagios守护进程的检测逻辑进程初始化。当Nagios需要进行对主机和服务进行状态检测时,它将需要检测的信息传给一个插件,由插件来检测主机或服务并给出一个可供进一步运作的状态,将结果返给Nagios守护进程。Nagios按照主机或服务的结果来做适当地动作(如发出告警、执行事件处理句柄等)
有关插件是如何工作的更多信息可以在这里找到。
自主检测将在如下情况执行:
- 当规格化时间到达时;规格化时间由主机和服务定义的check_interval和retry_interval选项决定。
- 进程必须处于守护状态;
规格化计划检测发生的间隔要么是check_interval要么是retry_interval,这取决于主机与服务当前处于什么状态类型。如果主机与服务是处于硬态,实际检测间隔将等于check_interval值,如果它处于软态,检测间隔将等于retry_interval值。
每当Nagios需要取得某特定主机或服务的最新状态时,将会去做按需检测。例如当Nagios要判断主机的可达性时,它通常会去做针对主机父节点及子节点的按需检测以决定该网段的状态。按需检测同样发生于依赖性检测的前处理逻辑之中,以确保Nagios得到最为准确的状态信息。
通常情况下Nagios监控主机与服务使用规格化计划表来做自主检测。自主检测使用“轮询”机制来对设备或服务的状态信息进行收集,这是常见方式。Nagios同样支持用另一种方式,即被动方式来替代自主方式来检测,强制检测的关键特性是:
- 强制检测被外部应用或进程初始化和执行;
- 强制检测的结果交给Nagios来处理;
自主检测与被动检测的最主要不同是自主检测是由Nagios来做初始化和执行而强制检测是由外部应用程序来做。
强制检测在如下监控中很有用:
- 本身是异步的并且无法有效地基于一个规格化计划表来轮询的监控;
- 被监控主机位于防火墙后面无法从监控服务器送出自主检测;
异步式服务的例子是自身提供包括SNMP陷井或安全警告等强制监控方式的服务。从来不会知道在一个指定时间片段里将会收到多少SNMP陷井或安全警告,所以这些不适合用每几分钟来判定一下被监控的状态。
更详细的强制检测的工作机制是...
- 一个外部应用对主机或服务的状态进行检查;
- 外部程序将检测结果写入外部命令文件之中;
- 每次Nagios读入外部命令文件并将全部强制检测结果写入一个将要处理的队列中,该队列同样会保存自主检测结果;
- Nagios将定期执行检测结果接收的事件处理并扫描结果队列。在队列里可找到的每个服务检测结果都会同样处理 - 不管这个检测结果是自主检测的还是强制检测的结果 - Nagios将按照检测结果送出通知、记录警告等。
对自主检测与强制检测的处理本质上是一致的,这使得Nagios与其他的外部应用无缝集成。
在Nagios里使能强制检测需要做如下设置:
- 将accept_passive_service_checks域设置为1;
- 在主机与服务对象定义里将passive_checks_enabled域设定为1;
如果想全局地关闭强制检测,将accept_passive_service_checks域设置为0;
如果只想对几个主机与服务关闭强制检测,在对象与服务对象定义里用passive_checks_enabled域来控制。
外部应用通过写入一个PROCESS_SERVICE_CHECK_RESULT外部命令到外部命令文件中来告诉Nagios提交了一个强制检测结果。
命令的格式是:
[<timestamp>] PROCESS_SERVICE_CHECK_RESULT;<host_name>;<svc_description>;<return_code>;<plugin_output>
参数说明:
- timestamp是一个time_t格式的时间戳来表征检测动作的时间,注意有在方括号的右侧有一个空格;
- host_name是主机与服务对象定义里的短名称;
- svc_description是指定服务对象定义里的服务描述;
- return_code是返回的检测结果(0=正常(OK), 1=报警(WARNING), 2=紧急(CRITICAL), 3=未知(UNKNOWN));
- plugin_output是服务检测的文本输出(如同插件输出)。
注意
外部应用通过写一个PROCESS_HOST_CHECK_RESULT外部命令到外部命令文件中来告诉Nagios提交了一个强制检测结果。
命令格式是:
[<timestamp>].PROCESS_HOST_CHECK_RESULT;<host_name>;<host_status>;<plugin_output>
参数说明:
- timestamp是一个time_t格式的时间戳来表征检测动作的时间,注意有在方括号 的右侧有一个空格;
- host_name是主机对象定义里的短名称;
- host_status是主机的状态(0=运行(UP), 1=宕机(DOWN), 2=不可达(UNREACHABLE));
- plugin_output是服务检测的文本输出(如同插件输出)。
必须在Nagios提交主机对象定义后才可以提交检测结果;Nagios将会忽略没有最后一次启动后读入的配置文件里所做对象定义的全部检测结果。
与自主检测不同,Nagios(默认)不会在强制检测时尝试判定主机是宕机(DOWN)或不可达(UNREACHABLE)。Nagios把强制检测结果当做真实的主机状态,并且不会使用网络可达性检测逻辑来判定主机的真正状态。如果是想对远程主机的强制检测进行判定时将会导致问题,同样,在一个分布式监控环境下因父/子节点的关系不一样时也会有问题。
可以设置令Nagios在强制检测的状态是宕机(DOWN)/不可达(UNREACHABLE)时变换到一个“合理”的状态,通过设置translate_passive_host_checks变量来做变换即可,更详细地关于如何设置它的信息可以查阅这篇文档。
每次修改过你的配置文件,你应该运行一次检测程序来验证配置的正确性。在运行你的Nagios程序之前这是很重要的,否则的话会导致Nagios服务因配置的错误而关闭。
为验证你配置,运行Nagios带命令行参数 -v,象这样:
/usr/local/nagios/bin/nagios -v /usr/local/nagios/etc/nagios.cfg
如果你确实忘记了一些重要的数据或是错误地配置了,Nagios将会给出一个报警或是一个错误信息,其中会给出错误的位置。错误信息通常会打印出错误配置的文件中的那一行。在错误时,Nagios通常是在预检查出有问题打印出问题的源配置文件行后退回到命令行状态。这使得Nagios不会因一个错误而落入需要验证一个因错误而嵌套的配置循环错误之中。报警信息可通常是被忽略的,因为一般那些只是建议性的并非必须的。
一旦你已经验证了你配置文件并修改过你的错误,就可以继续下去,启动或重启Nagios服务了。
有多于一种方式来启动、停止和重启动Nagios,这里在有更通常做的方式...
- 初始化脚本:最简单的启动Nagios守护进程的方式是使用初始化脚本,象这样:
/etc/rc.d/init.d/nagios start
- 手工方式:你可以手动地启动Nagios守护进程,用命令参数-d,象这样:
/usr/local/nagios/bin/nagios -d /usr/local/nagios/etc/nagios.cfg
当你修改了配置文件并想使之生效的话,重启动或重载入动作是必须的。
- 初始化脚本:最简单地重启动Nagios守护进程的方式是使用初始化脚本,象这样:
/etc/rc.d/init.d/nagios reload
- Web接口方式:你可以利用WEB接口,通过点击“进程信息”的超链接页面里的“重启动Nagios进程”来重启动Nagios,见图

- 手工方式:你可以手动地发一个SIGHUP信号,象这样:
kill -HUP <nagios_pid>
只有很少几件事可以减少Nagios的启动或重启总时间。加速启动方法包括有移除些负担还包括加快配置文件处理过程。
利用这些技术在如下一种或几种情况时特别有效:
- 大型安装配置
- 复杂地配置(过度地利用模板特性)
- 需要进行频繁重启动的安装模式
每次Nagios启动和重启时,在它着手进行监控工作之前必须要处理配置文件。启动过程中的配置处理包括如下几步:
- 读入配置文件
- 解析模板定义
- 重粘连("Recombobulating")对象(是我想到的应做各种工作)
- 复制对象定义
- 继承对象属性
- 对象定义排序
- 验证对象关联关系的完整性
- 验证回路
- 和其他...
当有很大的或是很复杂的配置文件要处理时有几步非常消耗时间的。有没有加快这些的办法?当然有!
在做让启动速度更快的事情之前,需要看看可能性有多少和是否有必要涉足此事。这个比较容易-只是用-s命令行开关启动Nagios以取得计时和调度信息。
下面是个输出样例(做过精减,只是显示了有关部分),在这个例子中,假定Nagios配置为对25个主机和超过10,000个服务进行监控。
/usr/local/nagios/bin/nagios -s /usr/local/nagios/etc/nagios.cfg
Nagios 3.0-prealpha
Copyright (c) 1999-2007 Ethan Galstad (http://www.nagios.org)
Last Modified: 01-27-2007
License: GPL

Timing information on object configuration processing is listed
below.  You can use this information to see if precaching your
object configuration would be useful.

Object Config Source: Config files (uncached)

OBJECT CONFIG PROCESSING TIMES      (* = Potential for precache savings with -u option)
----------------------------------
Read:                 0.486780 sec
Resolve:              0.004106 sec  *
Recomb Contactgroups: 0.000077 sec  *
Recomb Hostgroups:    0.000172 sec  *
Dup Services:         0.028801 sec  *
Recomb Servicegroups: 0.010358 sec  *
Duplicate:            5.666932 sec  *
Inherit:              0.003770 sec  *
Recomb Contacts:      0.030085 sec  *
Sort:                 2.648863 sec  *
Register:             2.654628 sec
Free:                 0.021347 sec
                      ============
TOTAL:                11.555925 sec  * = 8.393170 sec (72.63%) estimated savings


Timing information on configuration verification is listed below.

CONFIG VERIFICATION TIMES          (* = Potential for speedup with -x option)
----------------------------------
Object Relationships: 1.400807 sec
Circular Paths:       54.676622 sec  *
Misc:                 0.006924 sec
                      ============
TOTAL:                56.084353 sec  * = 54.676622 sec (97.5%) estimated savings
OK,看看发生了什么。先看汇总信息,大概有11.6秒用于处理配置文件有56秒来验证配置。这意味着每次用这个配置启动或重启Nagios时,它大约会有68秒来做启动事项而不会做任何监控的事情!如果是在定制配置Nagios过程中也是不可容忍的。
那么怎么办?看一下输出内容,如果运用了优化选项,Nagios将可以在配置读取过程节省大约8.4秒而在验证过程可节省63秒。
哇!从68秒到只有5秒?!是的!看看下面是怎么做到的。
Nagios可在解析配置文件过程中做些加速,特别是当配置中使用了模板来做继承等的时候。为降低Nagios解析配置文件的处理时间可用Nagios预处理与预缓存配置文件的功能。
当用-p命令参数来运行Nagios时,Nagios将读入配置文件,处理后将配置结果写入预缓存文件(由主配置文件中precached_object_file域指定文件位置)。该预缓存配置文件将包含了预处理后的信息将使Nagios处理配置文件更容易和快捷。必须把-p参数选项与-v或-s命令参数一起使用,如下例。注意要做预缓存配置文件之前配置应是已被验证过的。
/usr/local/nagios/bin/nagios -pv /usr/local/nagios/etc/nagios.cfg
预缓存配置文件有大小明显地比原有配置文件大。这是正常的由设计初衷决定的。

一旦预缓存对象配置文件创建,可以启动Nagios时带上-u命令行选项以让它使用预缓存配置文件而不是配置文件本身。
/usr/local/nagios/bin/nagios -ud /usr/local/nagios/etc/nagios.cfg
重要


第二步(也是最耗时)部分是对配置中的回路进行检测。在上面例子中这一步几乎用去了1分钟来验证配置验证。
什么时回路检测和为什么要做这么长时间?回路检测逻辑是为了确保在你的主机、主机依赖、服务和服务依赖等对象之间不存在任何的循环路径。如果在配置中有循环路径,Nagios将会因死锁而停止。用时较长原因是由于没有使用较高效的算法。欢迎提供更高效发现回路的算法。提示:这意味着EMail给我有关Nagios论文的计算机科学系研究生将有机会得到些回赠代码。:-)
如果你想在Nagios为启动时跳过回路检测,可以在命令行回加上-x参数,象这样:
/usr/local/nagios/bin/nagios -xd /usr/local/nagios/etc/nagios.cfg
重要
按照下面步骤将会使用预缓存配置文件并且跳过回路检测以充分加速启动。
1、验证配置文件并生成预缓存配置文件,用如下命令:
/usr/local/nagios/bin/nagios -vp /usr/local/nagios/etc/nagios.cfg
2、如果Nagios正在运行,停掉它;
3、启动Nagios,让其使用预缓存配置文件而且跳过回路检测:
/usr/local/nagios/bin/nagios -uxd /usr/local/nagios/etc/nagios.cfg
4、当更改了原始配置文件时,需要重启动Nagios并修改现有内容,重新回到步骤1去验证配置并重构预缓存配置文件。一旦做好了,就可以通过Web接口来重启Nagios或是在系统中发个SIGHUP信号,如果没有重构预缓存配置文件,Nagios将用旧配置运行,因为它首先会读入缓存配置文件而不是源配置文件;
5、就这么多!祝你可以加快启动过程。
这里将描述一下随Nagios发行的几个CGI程序模块,每个CGI模块都需要做充分的授权设置。默认情况下CGI程序将依依赖于你在Web服务程序里的授权和对你所请求的视图给你的授权。更多的有关授权配置的信息可以在这里找到。
Status CGI


模块文件名status.cgi
描述:在Nagios里这是一个很重要的CGI模块。它可以让你观测到被监测的全部主机和服务的当前状态。它将生成本个主机类型的输出报告 - 全部的(或部分主机)以成组方式给出状态报告和全部的服务(或部分主机上的全部服务)的状态。
授权要求:
Status Map CGI

模块文件名statusmap.cgi
描述:这个CGI模块将创建一个基于你监测网络全部主机的二维地图。使用Thomas Boutell的gd库(版本是1.6.3或更高)来生成一个PNG图,里面的二维坐标依赖于每个主机对象的定义(包括可以给每个主机定义一个好看的图标)。如果你宁可让CGI程序自己自动地设定主机的坐标,用一下这个default_statusmap_layout域来指定一个二维图生成算法。
授权要求:
- 如果你已被授权对全部主机你就可以看到全部主机。
- 如果你是一个被授权的联系人你就可以看到以你为联系人的主机。
注意
没有被授权的用户只能看到那些主机的节点处于未知状态。我真的让它无法看到任何东西,如果你无法看到主机依赖的话,你甚至无法看到一个二维图...
WAP Interface CGI

模块文件名statuswml.cgi
描述:这个CGI模块将给WAP接口提供网络状态服务。如果你有一个WAP设备(象一个带因特网接入能力的移动电话),你可以在移动中观看状态信息。在主机组汇总、主机概览、主机详细信息、服务详细信息、全部的故障告警、全部未处理故障等等不同的报告,除了状态信息外,同样可以从移动电话里来设置取消告警、关闭检测和通知故障等。这个功能很酷吧?
授权要求:
Status World CGI (VRML)

模块文件名statuswrl.cgi
描述:这个CGI模块将对你所监控网络的全部主机生成一个三维虚拟视图。这些绘制中所用的主机三维坐标(以及渲染图片)来自于配置文件中的主机定义。如果你想让CGI程序模块自动地生成三维坐标,可以设置default_statuswrl_layout域来指定一个三维图坐标生成算法。同样,在你要做观察之前你也应在你系统里安装一个虚拟现实的浏览器(象Cortona、Cosmo Player或WorldView)。
授权要求:
- 如果你已被授权对全部主机你就可以看到全部主机。
- 如果你是一个被授权的联系人你就可以看到以你为联系人的主机。
注意
对于没有被授权的用户,将在没授权的主机节点上看到未知状态。我真的让他无法看到任何东西,如果你无法看到主机依赖关系时你甚至无法看到一个三维图...
Tactical Overview CGI

模块文件名tac.cgi
描述:这个CGI模块给了一个网络活动的“鸟瞰图”。这容许你快速地得到网络概况、主机状态和服务状态。在已被“处理”的故障(象被认同的和关闭告警的故障)和没有被捕获的问题之间做出区分辨别,且是需要提请关注的。如果你在监控大量的主机和服务并且想只是用一组画面来分析处理这些故障的话这个会很有用。
授权要求:
Network Outages CGI

模块文件名outages.cgi
描述:这个CGI将给出你网络中的引发网络出错的“问题”主机列表。这对于管理一个大型的网络和想快速定位网络故障来源的情况是很有用的。列表中的主机将按出错问题的先后关系来排列。
授权要求:
- 如果你已被授权对全部主机你就可以看到全部主机。
- 如果你是一个被授权的联系人你就可以看到以你为联系人的主机。
Configuration CGI

模块文件名config.cgi
描述:这个CGI模块将让你可以看到全部对象(象主机、主机组、联系人、联系人组、时间周期、服务等等)的配置,这些配置写在你的对象配置文件里面。
授权要求:
- 你必须被授权可以看到任何配置信息和任意一种配置内容。
Command CGI

模块文件名cmd.cgi
描述:这个CGI模块将让你给Nagis进程发出命令。虽然它有很多个命令参数,但你最好是独立地使用它们。在不同的Nagios版本间它们有很大地不同。用extended information CGI模块来做为发布命令的起点。
授权要求:
- 你必须被授权做系统命令以使你发出对Nagios有影响的命令(重启动、关闭、模式切换等等)。
- 如果你被授权在全部主机上执行命令以使你可以对全部主机和服务发出命令。
- 如果你被授权对全部服务执行命令以使你可对全部服务发出命令。
- 如果你是一个被授权的联系人你可以对你做为联系人的主机和服务上发出命令。
注意
如果没有使用在CGI配置文件里use_authentication选项,这个CGI模块将不会让你对Nagios执行任何命令,这是对你设置的一种保护。如果你决定在WEB里设置成非授权管理状态来运行,我建议你最好移走这个CGI模块。
Extended Information CGI


模块文件名extinfo.cgi
描述:这个CGI模块将让你看到Nagios进程信息、主机和服务状态统计、主机和服务注释和其他信息等。同样它也可以做为对Nagios发出命令的服务,跟command CGI模块一样。虽然它有几个命令参数,但你最好是独立地用它们 - 在不同的Nagios版本之间它们会有不同。你可以通过点击在页面边上的“网络健康状况”和“进程信息”里的链接来进到这个CGI模块,也可以通过点击status CGI里的主机或服务上的链接进入。
授权要求:
Event Log CGI

模块文件名showlog.cgi
描述:此CGI模块用于显示日志文件。如果已设置日志回滚使能,可以用顶部的导航链接来在打包的日志文件中浏览当前告警。
授权要求:
- 你必须被授权看系统信息以使你可看到日志文件报告。
Alert History CGI

模块文件名history.cgi
描述:这个CGI模块被用于显示部分或是全部主机的历史故障。这个是显示日志文件CGI模块信息的子集。你可以过滤显示输出内容,只挑出指定类型的故障来查看(如按硬故障和软故障分类,或按服务和主机告警的类型来显示等)。如果你设置了日志回滚,你可以通过页面顶端的导航链接来在打包的日志文件中查看当前的历史信息。
授权要求:
Notifications CGI

模块文件名notifications.cgi
描述:这个CGI模块可以用于显示给各类联系人而发出主机和服务的通知。这个输出是 The output is basically a subset of the information that is displayed by the 日志CGI模块显示内容的子集。你可以过滤输出显示内容,只是显示指定的通知类型(如服务通知、主机通知、给指定联系人的通知等)。如果设置了日志回滚选项使能,你可以通过在页面顶端的导航链接来在打包的日志文件中查看当前的通知。
授权要求:
Trends CGI

模块文件名trends.cgi
描述:这个CGI模块可以创建一个主机或服务的任意时间段内的状态趋势图。为了让此CGI模块更有用,你需要设置日志回滚选项使能并保留好打包的日志文件,打包日志文件保留路径在log_archive_path域里设置。这个CGI模块使用了Thomas Boutell的gd库(版本1.6.3或更高)以创建状态趋势图。
授权要求:
Availability Reporting CGI


模块文件名avail.cgi
描述:这个CGI模块可用于查看用户定制的指定时间段内的可用性报告。为使这个CGI程序更多地被运用,你要设置日志回滚使能并保留打包的日志文件,日志文件保存于log_archive_path域里面。
授权要求:
Alert Histogram CGI

模块文件名histogram.cgi
描述:这个CGI模块可用于显示在用户定制的时间段内的主机和服务的可用性曲线。为使这个CGI更多地利用,你须设置日志回滚选项并保留你的打包日志文件,日志文件保存于log_archive_path域设置的路径里。这个CGI模块使用了Thomas Boutell的gd库(版本1.6.3或更高)以创建历史曲线图。
授权要求:
Alert Summary CGI

模块文件名summary.cgi
描述:这个CGI模块提供了有关主机和服务告警的概要性的报告,包括总的和最大的告警源等。
授权要求:
插件是编译的执行文件或脚本(Perl脚本、SHELL脚本等等),可以在命令行下执行对主机或服务的状态检查。Nagios运行这些插件的检测结果来决定网络中的主机和服务的当前状态。
当需要检测主机或服务的状态时Nagios总是执行一个插件程序,插件总要做点事情(注意一般条件下)来完成检查并给出简洁的结果给Nagios。Nagios将处理这些来自插件的结果并做些该做的动作(运行事件处理句柄、发送出告警等)。
插件扮演了位于Nagios守护程序里的监控逻辑和实际被监控的主机与服务之间的抽象层次。
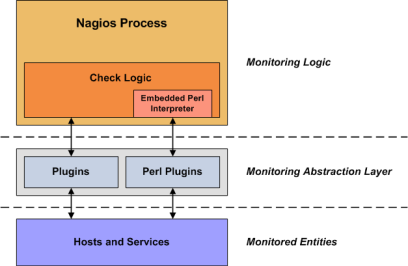
在插件构架之上你可以监控所有你想要监控的东西。如果你能自动地处理检测过程你就可以用Nagios来监控它。已经写好很多插件以用于监控基础性资源象处理器负荷、磁盘利用率、PING包率等,如果你想监控点别的,你需要查阅书写插件这篇文档并自己付出努力,这很简单地!
在插件构架之下,事实上Nagios也不知道你想要搞些什么名堂。你可以监控网络流量态势、数据错包率、房间温度、CPU电压值、风扇转速、处理器负载、磁盘空间或是有可能在早上起来你的超级无敌的面包机烤出正宗的色泽...Nagios不会理解什么被监控了-它只是忠实地记录下了这些被管理资源的状态变化轨迹。只有插件自已知道监控了什么东西并如何完成检测。
有许多插件可用于监控不同的设备和服务,包括:
- HTTP、POP3、IMAP、FTP、SSH、DHCP
- CPU负荷、磁盘利用率、内存占用、当前用户数
- Unix/Linux、Windows和Netware服务器
- 路由器和交换机
- 等等
插件不与Nagios包一起发布,但你可以下载到Nagios官方插件和由Nagios用户书写并维护的额外插 件,在这些网址里:
- Nagios Plugins工程http://nagiosplug.sourceforge.net/
- Nagios下载页面http://www.nagios.org/download/
- NagiosExchange.orghttp://www.nagiosexchange.org/
当你在命令行下用命令参数-h或-help运行时许多插件会显示基本用法信息。例如如果你想知道如何使用check_http插件或是它的可接收哪些选项参数时,你只要尝试运行:
./check_http --help
就可以看到提示内容了。
你可以在这里找到有关插件技术论述的信息并且有如何书写你自己定制插件的内容。
在Nagios执行命令之前,它将对命令里的每个宏替换成它们应当取得的值。这种宏替换发生在Nagios在执行各种类型的宏时候 - 象主机和服务的检测、通知、事件处理等。
有些特定的宏包含了其他宏,这些宏包括$HOSTNOTES$、$HOSTNOTESURL$、$HOSTACTIONURL$、$SERVICENOTES$、$SERVICENOTESURL$和$SERVICEACTIONURL$。
当在命令定义中使用主机或服务宏时,宏将要执行所用的值是指向主机或服务所带有值。尝试这个例子,假定在check_ping命令定义里使用了一个主机对象,象这样:
define host{
		host_name		linuxbox
		address		192.168.1.2
		check_command	check_ping
		...
		}
		define command{
		command_name    check_ping
		command_line    /usr/local/nagios/libexec/check_ping -H $HOSTADDRESS$ -w 100.0,90% -c 200.0,60%
		}
那么执行这个主机检测命令时展开并最终执行的将是这样的:
/usr/local/nagios/libexec/check_ping -H 192.168.1.2 -w 100.0,90% -c 200.0,60%
很简单,对吧?优美之处在于你可以在只用一个命令定义来完成无限制的多个主机的检测。每个主机可以使用相同的命令来进行检测,而在对他们检测之前将把主机地址正确地替换。
同样你可以向命令传递参数,这样可以保证你的命令定义更具通用性。参数指定在对象(象主机或服务)中定义,用一个“!”来分隔他们,象这样:
define service{
		host_name		linuxbox
		service_description	PING
		check_command	check_ping!200.0,80%!400.0,40%
		...
		}
在上例中,服务的检测命令中含有两个参数(请参考$ARGn$宏),而$ARG1$宏将是"200.0,80%",同时$ARG2$将是"400.0,40%"(都不带引号)。假定使用之前的主机定义并这样来定义你的check_ping命令:
define command{
		command_name    check_ping
		command_line    /usr/local/nagios/libexec/check_ping -H $HOSTADDRESS$ -w $ARG1$ -c $ARG2$
		}
那么对于服务的检测命令最终将是这样子的:
/usr/local/nagios/libexec/check_ping -H 192.168.1.2 -w 200.0,80% -c 400.0,40%
提示
如果你需要在你的命令行里使用这个(!)字符,你得加上转义符反斜线(\),就是你要写成(\!)。如果想用反斜线,同样得加转义符,写成(\\)。
通常在在命令对象定义里使用主机和服务的宏,用以在命令执行时指向某个服务或是主机。但也就是说,一个在对命名为linuxbox的主机上执行命令时,全部的标准的主机宏都应使用这个主机值都是正运行的主机名linuxbox。
如果不想这样,也是是让命令里引用的主机或服务宏指向另外一些主机或服务,你可以用“按需生成的宏”的机制。除了那个需要指定从哪个给主机或服务时取值而包含在内的标识之外,按需而成的宏看起来就象是一般的宏。这里是基本的“按需而成的宏”的基本格式:
- $HOSTMACRONAME:host_name$
- $SERVICEMACRONAME:host_name:service_description$
用标准的主机和服务的宏名字替换HOSTMACRONAME和SERVICEMACRONAME,这些标准的宏可以在这里查到。
要注意宏的名字与主机和服务的标识之间隔有一个(:)符号。为了形成表达按需而成的服务宏的标识,在标识里既有主机名又有服务描述-他们俩用一个(:)符号分开。
提示
按需而成的服务宏可以包含主机名域为空,此时所绑定的主机由服务结合情况自行来指定。
下面是按需而成的主机和服务宏的例子:
		$HOSTDOWNTIME:myhost$                        <--- On-demand host macro
		$SERVICESTATEID:novellserver:DS Database$    <--- On-demand service macro
		$SERVICESTATEID::CPU Load$                   <--- On-demand service macro with blank host name field
按需而成的宏同样可以运用于主机组、服务组、联系人和联系人组宏里,例如:
		$CONTACTEMAIL:john$                          <--- On-demand contact macro
		$CONTACTGROUPMEMBERS:linux-admins$           <--- On-demand contactgroup macro
		$HOSTGROUPALIAS:linux-servers$               <--- On-demand hostgroup macro
		$SERVICEGROUPALIAS:DNS-Cluster$              <--- On-demand servicegroup macro
在主机、服务或联系人等对象里的任何一个用户自定制变量都可以联接宏。用户自定制的变量宏命名如下:
- $_HOSTvarname$
- $_SERVICEvarname$
- $_CONTACTvarname$
如下的主机对象定义中定义了一个用户自定制变量是"_MACADDRESS",见细节:
define host{
		host_name		linuxbox
		address		192.168.1.1
		_MACADDRESS	00:01:02:03:04:05
		...
		}
那么主机对象的_MACADDRESS用户自定制变量的值就可以在宏$_HOSTMACADDRESS$里面使用。你可以在这里找到更多的关于用户自定制变量以及如何在宏里使用它的信息。
在命令执行之前,有些宏要去掉那些可能会引起SHELL潜在风险的元字符。这些元字符由illegal_macro_output_chars选项来定义。下面这些宏是要做这种处理的:
由Nagios将宏变成一个操作系统的环境变量将有利于在脚本或命令执行时引用。为保证安全和清晰的思路,$USERn$和"按需而成on-demand"的主机和服务宏是不可以被作为环境变量的。
环境变量的命名与其包含的命名标准宏(列表在这里)的名字是相关的,它们的名字前面加前缀"NAGIOS_"。比如说$HOSTNAME$宏在环境变量里被命名为"NAGIOS_HOSTNAME".
所有的在Nagios里的可用的宏以及如何使用它们的列表可以在这里查找。
这里列出了Nagios里可用的标准宏。按需生成的宏和用户定制变量宏在这篇文档里有说明。
虽然宏可被用于定义的各种命令之中,但并非每种宏在特定环境里是“合法”的。如,有些宏只是在服务通知命令里有效,而另外一些只在主机检测命令里有用。Nagios可以辨识和处理的情况有十种不同类型,它们就是:
下面表格中列出了在Nagios可用的全部的宏,并且每个宏都有一个简短说明及什么样命令是有效的。如果宏在无效的命令中使用,可能会被空串替代。须注意全部宏是大写字符且名字里最前和最后都有$字符。
表 8.2. 主机宏:3
| 宏名 | 服务检测 | 服务通知 | 主机检测 | 主机通知 | 服务事件处理与OCSP | 主机事件处理与OCHP | 服务性能 | 主机性能 |
|---|---|---|---|---|---|---|---|---|
| $HOSTNAME$ | Yes | Yes | Yes | Yes | Yes | Yes | Yes | Yes |
| $HOSTDISPLAYNAME$ | Yes | Yes | Yes | Yes | Yes | Yes | Yes | Yes |
| $HOSTALIAS$ | Yes | Yes | Yes | Yes | Yes | Yes | Yes | Yes |
| $HOSTADDRESS$ | Yes | Yes | Yes | Yes | Yes | Yes | Yes | Yes |
| $HOSTSTATE$ | Yes | Yes | Yes 1 | Yes | Yes | Yes | Yes | Yes |
| $HOSTSTATEID$ | Yes | Yes | Yes 1 | Yes | Yes | Yes | Yes | Yes |
| $LASTHOSTSTATE$ | Yes | Yes | Yes | Yes | Yes | Yes | Yes | Yes |
| $LASTHOSTSTATEID$ | Yes | Yes | Yes | Yes | Yes | Yes | Yes | Yes |
| $HOSTSTATETYPE$ | Yes | Yes | Yes 1 | Yes | Yes | Yes | Yes | Yes |
| $HOSTATTEMPT$ | Yes | Yes | Yes | Yes | Yes | Yes | Yes | Yes |
| $MAXHOSTATTEMPTS$ | Yes | Yes | Yes | Yes | Yes | Yes | Yes | Yes |
| $HOSTEVENTID$ | Yes | Yes | Yes | Yes | Yes | Yes | Yes | Yes |
| $LASTHOSTEVENTID$ | Yes | Yes | Yes | Yes | Yes | Yes | Yes | Yes |
| $HOSTPROBLEMID$ | Yes | Yes | Yes | Yes | Yes | Yes | Yes | Yes |
| $LASTHOSTPROBLEMID$ | Yes | Yes | Yes | Yes | Yes | Yes | Yes | Yes |
| $HOSTLATENCY$ | Yes | Yes | Yes | Yes | Yes | Yes | Yes | Yes |
| $HOSTEXECUTIONTIME$ | Yes | Yes | Yes 1 | Yes | Yes | Yes | Yes | Yes |
| $HOSTDURATION$ | Yes | Yes | Yes | Yes | Yes | Yes | Yes | Yes |
| $HOSTDURATIONSEC$ | Yes | Yes | Yes | Yes | Yes | Yes | Yes | Yes |
| $HOSTDOWNTIME$ | Yes | Yes | Yes | Yes | Yes | Yes | Yes | Yes |
| $HOSTPERCENTCHANGE$ | Yes | Yes | Yes | Yes | Yes | Yes | Yes | Yes |
| $HOSTGROUPNAME$ | Yes | Yes | Yes | Yes | Yes | Yes | Yes | Yes |
| $HOSTGROUPNAMES$ | Yes | Yes | Yes | Yes | Yes | Yes | Yes | Yes |
| $LASTHOSTCHECK$ | Yes | Yes | Yes | Yes | Yes | Yes | Yes | Yes |
| $LASTHOSTSTATECHANGE$ | Yes | Yes | Yes | Yes | Yes | Yes | Yes | Yes |
| $LASTHOSTUP$ | Yes | Yes | Yes | Yes | Yes | Yes | Yes | Yes |
| $LASTHOSTDOWN$ | Yes | Yes | Yes | Yes | Yes | Yes | Yes | Yes |
| $LASTHOSTUNREACHABLE$ | Yes | Yes | Yes | Yes | Yes | Yes | Yes | Yes |
| $HOSTOUTPUT$ | Yes | Yes | Yes 1 | Yes | Yes | Yes | Yes | Yes |
| $LONGHOSTOUTPUT$ | Yes | Yes | Yes 1 | Yes | Yes | Yes | Yes | Yes |
| $HOSTPERFDATA$ | Yes | Yes | Yes 1 | Yes | Yes | Yes | Yes | Yes |
| $HOSTCHECKCOMMAND$ | Yes | Yes | Yes | Yes | Yes | Yes | Yes | Yes |
| $HOSTACKAUTHOR$8 | No | No | No | Yes | No | No | No | No |
| $HOSTACKAUTHORNAME$8 | No | No | No | Yes | No | No | No | No |
| $HOSTACKAUTHORALIAS$8 | No | No | No | Yes | No | No | No | No |
| $HOSTACKCOMMENT$8 | No | No | No | Yes | No | No | No | No |
| $HOSTACTIONURL$ | Yes | Yes | Yes | Yes | Yes | Yes | Yes | Yes |
| $HOSTNOTESURL$ | Yes | Yes | Yes | Yes | Yes | Yes | Yes | Yes |
| $HOSTNOTES$ | Yes | Yes | Yes | Yes | Yes | Yes | Yes | Yes |
| $TOTALHOSTSERVICES$ | Yes | Yes | Yes | Yes | Yes | Yes | Yes | Yes |
| $TOTALHOSTSERVICESOK$ | Yes | Yes | Yes | Yes | Yes | Yes | Yes | Yes |
| $TOTALHOSTSERVICESWARNING$ | Yes | Yes | Yes | Yes | Yes | Yes | Yes | Yes |
| $TOTALHOSTSERVICESUNKNOWN$ | Yes | Yes | Yes | Yes | Yes | Yes | Yes | Yes |
| $TOTALHOSTSERVICESCRITICAL$ | Yes | Yes | Yes | Yes | Yes | Yes | Yes | Yes |
表 8.4. 服务宏:
| 宏名 | 服务检测 | 服务通知 | 主机检测 | 主机通知 | 服务事件处理与OCSP | 主机事件处理与OCHP | 服务性能 | 主机性能 |
|---|---|---|---|---|---|---|---|---|
| $SERVICEDESC$ | Yes | Yes | No | No | Yes | No | Yes | No |
| $SERVICEDISPLAYNAME$ | Yes | Yes | No | No | Yes | No | Yes | No |
| $SERVICESTATE$ | Yes 2 | Yes | No | No | Yes | No | Yes | No |
| $SERVICESTATEID$ | Yes 2 | Yes | No | No | Yes | No | Yes | No |
| $LASTSERVICESTATE$ | Yes | Yes | No | No | Yes | No | Yes | No |
| $LASTSERVICESTATEID$ | Yes | Yes | No | No | Yes | No | Yes | No |
| $SERVICESTATETYPE$ | Yes | Yes | No | No | Yes | No | Yes | No |
| $SERVICEATTEMPT$ | Yes | Yes | No | No | Yes | No | Yes | No |
| $MAXSERVICEATTEMPTS$ | Yes | Yes | No | No | Yes | No | Yes | No |
| $SERVICEISVOLATILE$ | Yes | Yes | No | No | Yes | No | Yes | No |
| $SERVICEEVENTID$ | Yes | Yes | No | No | Yes | No | Yes | No |
| $LASTSERVICEEVENTID$ | Yes | Yes | No | No | Yes | No | Yes | No |
| $SERVICEPROBLEMID$ | Yes | Yes | No | No | Yes | No | Yes | No |
| $LASTSERVICEPROBLEMID$ | Yes | Yes | No | No | Yes | No | Yes | No |
| $SERVICELATENCY$ | Yes | Yes | No | No | Yes | No | Yes | No |
| $SERVICEEXECUTIONTIME$ | Yes 2 | Yes | No | No | Yes | No | Yes | No |
| $SERVICEDURATION$ | Yes | Yes | No | No | Yes | No | Yes | No |
| $SERVICEDURATIONSEC$ | Yes | Yes | No | No | Yes | No | Yes | No |
| $SERVICEDOWNTIME$ | Yes | Yes | No | No | Yes | No | Yes | No |
| $SERVICEPERCENTCHANGE$ | Yes | Yes | No | No | Yes | No | Yes | No |
| $SERVICEGROUPNAME$ | Yes | Yes | No | No | Yes | No | Yes | No |
| $SERVICEGROUPNAMES$ | Yes | Yes | No | No | Yes | No | Yes | No |
| $LASTSERVICECHECK$ | Yes | Yes | No | No | Yes | No | Yes | No |
| $LASTSERVICESTATECHANGE$ | Yes | Yes | No | No | Yes | No | Yes | No |
| $LASTSERVICEOK$ | Yes | Yes | No | No | Yes | No | Yes | No |
| $LASTSERVICEWARNING$ | Yes | Yes | No | No | Yes | No | Yes | No |
| $LASTSERVICEUNKNOWN$ | Yes | Yes | No | No | Yes | No | Yes | No |
| $LASTSERVICECRITICAL$ | Yes | Yes | No | No | Yes | No | Yes | No |
| $SERVICEOUTPUT$ | Yes 2 | Yes | No | No | Yes | No | Yes | No |
| $LONGSERVICEOUTPUT$ | Yes 2 | Yes | No | No | Yes | No | Yes | No |
| $SERVICEPERFDATA$ | Yes 2 | Yes | No | No | Yes | No | Yes | No |
| $SERVICECHECKCOMMAND$ | Yes | Yes | No | No | Yes | No | Yes | No |
| $SERVICEACKAUTHOR$8 | No | Yes | No | No | No | No | No | No |
| $SERVICEACKAUTHORNAME$8 | No | Yes | No | No | No | No | No | No |
| $SERVICEACKAUTHORALIAS$8 | No | Yes | No | No | No | No | No | No |
| $SERVICEACKCOMMENT$8 | No | Yes | No | No | No | No | No | No |
| $SERVICEACTIONURL$ | Yes | Yes | No | No | Yes | No | Yes | No |
| $SERVICENOTESURL$ | Yes | Yes | No | No | Yes | No | Yes | No |
| $SERVICENOTES$ | Yes | Yes | No | No | Yes | No | Yes | No |
表 8.8. 汇总统计宏:
| 宏名 | 服务检测 | 服务通知 | 主机检测 | 主机通知 | 服务事件处理与OCSP | 主机事件处理与OCHP | 服务性能 | 主机性能 |
|---|---|---|---|---|---|---|---|---|
| $TOTALHOSTSUP$10 | Yes | Yes 4 | Yes | Yes 4 | Yes | Yes | Yes | Yes |
| $TOTALHOSTSDOWN$10 | Yes | Yes 4 | Yes | Yes 4 | Yes | Yes | Yes | Yes |
| $TOTALHOSTSUNREACHABLE$10 | Yes | Yes 4 | Yes | Yes 4 | Yes | Yes | Yes | Yes |
| $TOTALHOSTSDOWNUNHANDLED$10 | Yes | Yes 4 | Yes | Yes 4 | Yes | Yes | Yes | Yes |
| $TOTALHOSTSUNREACHABLEUNHANDLED$10 | Yes | Yes 4 | Yes | Yes 4 | Yes | Yes | Yes | Yes |
| $TOTALHOSTPROBLEMS$10 | Yes | Yes 4 | Yes | Yes 4 | Yes | Yes | Yes | Yes |
| $TOTALHOSTPROBLEMSUNHANDLED$10 | Yes | Yes 4 | Yes | Yes 4 | Yes | Yes | Yes | Yes |
| $TOTALSERVICESOK$10 | Yes | Yes 4 | Yes | Yes 4 | Yes | Yes | Yes | Yes |
| $TOTALSERVICESWARNING$10 | Yes | Yes 4 | Yes | Yes 4 | Yes | Yes | Yes | Yes |
| $TOTALSERVICESCRITICAL$10 | Yes | Yes 4 | Yes | Yes 4 | Yes | Yes | Yes | Yes |
| $TOTALSERVICESUNKNOWN$10 | Yes | Yes 4 | Yes | Yes 4 | Yes | Yes | Yes | Yes |
| $TOTALSERVICESWARNINGUNHANDLED$10 | Yes | Yes 4 | Yes | Yes 4 | Yes | Yes | Yes | Yes |
| $TOTALSERVICESCRITICALUNHANDLED$10 | Yes | Yes 4 | Yes | Yes 4 | Yes | Yes | Yes | Yes |
| $TOTALSERVICESUNKNOWNUNHANDLED$10 | Yes | Yes 4 | Yes | Yes 4 | Yes | Yes | Yes | Yes |
| $TOTALSERVICEPROBLEMS$10 | Yes | Yes 4 | Yes | Yes 4 | Yes | Yes | Yes | Yes |
| $TOTALSERVICEPROBLEMSUNHANDLED$10 | Yes | Yes 4 | Yes | Yes 4 | Yes | Yes | Yes | Yes |
表 8.9. 通知宏:
| 宏名 | 服务检测 | 服务通知 | 主机检测 | 主机通知 | 服务事件处理与OCSP | 主机事件处理与OCHP | 服务性能 | 主机性能 |
|---|---|---|---|---|---|---|---|---|
| $NOTIFICATIONTYPE$ | No | Yes | No | Yes | No | No | No | No |
| $NOTIFICATIONRECIPIENTS$ | No | Yes | No | Yes | No | No | No | No |
| $NOTIFICATIONISESCALATED$ | No | Yes | No | Yes | No | No | No | No |
| $NOTIFICATIONAUTHOR$ | No | Yes | No | Yes | No | No | No | No |
| $NOTIFICATIONAUTHORNAME$ | No | Yes | No | Yes | No | No | No | No |
| $NOTIFICATIONAUTHORALIAS$ | No | Yes | No | Yes | No | No | No | No |
| $NOTIFICATIONCOMMENT$ | No | Yes | No | Yes | No | No | No | No |
| $HOSTNOTIFICATIONNUMBER$ | No | Yes | No | Yes | No | No | No | No |
| $HOSTNOTIFICATIONID$ | No | Yes | No | Yes | No | No | No | No |
| $SERVICENOTIFICATIONNUMBER$ | No | Yes | No | Yes | No | No | No | No |
| $SERVICENOTIFICATIONID$ | No | Yes | No | Yes | No | No | No | No |
表 8.11. 文件宏:
| 宏名 | 服务检测 | 服务通知 | 主机检测 | 主机通知 | 服务事件处理与OCSP | 主机事件处理与OCHP | 服务性能 | 主机性能 |
|---|---|---|---|---|---|---|---|---|
| $MAINCONFIGFILE$ | Yes | Yes | Yes | Yes | Yes | Yes | Yes | Yes |
| $STATUSDATAFILE$ | Yes | Yes | Yes | Yes | Yes | Yes | Yes | Yes |
| $COMMENTDATAFILE$ | Yes | Yes | Yes | Yes | Yes | Yes | Yes | Yes< 5 |
| $DOWNTIMEDATAFILE$ | Yes | Yes | Yes | Yes | Yes | Yes | Yes | Yes |
| $RETENTIONDATAFILE$ | Yes | Yes | Yes | Yes | Yes | Yes | Yes | Yes |
| $OBJECTCACHEFILE$ | Yes | Yes | Yes | Yes | Yes | Yes | Yes | Yes |
| $TEMPFILE$ | Yes | Yes | Yes | Yes | Yes | Yes | Yes | Yes |
| $TEMPPATH$ | Yes | Yes | Yes | Yes | Yes | Yes | Yes | Yes |
| $LOGFILE$ | Yes | Yes | Yes | Yes | Yes | Yes | Yes | Yes |
| $RESOURCEFILE$ | Yes | Yes | Yes | Yes | Yes | Yes | Yes | Yes |
| $COMMANDFILE$ | Yes | Yes | Yes | Yes | Yes | Yes | Yes | Yes |
| $HOSTPERFDATAFILE$ | Yes | Yes | Yes | Yes | Yes | Yes | Yes | Yes |
| $SERVICEPERFDATAFILE$ | Yes | Yes | Yes | Yes | Yes | Yes | Yes | Yes |
表 8.13. 主机宏:3
| $HOSTNAME$ | 主机简称(如"biglinuxbox"),取自于主机定义里的host_name域。 |
| $HOSTDISPLAYNAME$ | 可供替代显示的主机名,取自于主机定义里的display_name域。 |
| $HOSTALIAS$ | 主机全称、匿名或是描述,取自于主机定义里的alias域。 |
| $HOSTADDRESS$ | 主机地址。取自于主机定义里的address域。 |
| $HOSTSTATE$ | 当前主机状态的说明字符串("运行"、"宕机"或"不可达")。 |
| $HOSTSTATEID$ | 当前主机状态的标识数字(0=运行、1=宕机、2=不可达)。 |
| $LASTHOSTSTATE$ | 最后主机状态的说明字符串("运行", "宕机"或"不可达")。 |
| $LASTHOSTSTATEID$ | 最后主机状态的标识数字(0=运行、1=宕机、2=不可达)。 |
| $HOSTSTATETYPE$ | 主机检测时指示主机当前状态类型的字符串("硬态"或"软态")。软态是指当主机检测返回一个非正常状态并且开始进行重试时所处状态的状态类型。硬态是指当主机检测已经达到最大检测次数后所处的状态的状态类型。 |
| $HOSTATTEMPT$ | 主机检测当前的重试次数。比如,如果第二次要进行重检测,该宏的值是2。当前尝试次数只是反应出当主机事件处理处于软态时基于重试次数内执行指定动作的重试次数。 |
| $MAXHOSTATTEMPTS$ | 最大重试次数由当前主机对象定义给出。当写入软态时的主机事件处理做指定动作的重试时将会用到。 |
| $HOSTEVENTID$ | 全局的唯一ID值,指示当前主机状态,每次主机或服务经历一次状态变换,全局的事件ID计数器增1。如果主机没有经历状态变换,该值将置为0。 |
| $LASTHOSTEVENTID$ | 给定主机的前一个(全局唯一的)事件ID值。 |
| $HOSTPROBLEMID$ | A globally unique number associated with the host's current problem state. Every time a host (or service) transitions from an UP or OK state to a problem state, a global problem ID number is incremented by one (1). This macro will be non-zero if the host is currently a non-UP state. State transitions between non-UP states (e.g. DOWN to UNREACHABLE) do not cause this problem id to increase. If the host is currently in an UP state, this macro will be set to zero (0). Combined with event handlers, this macro could be used to automatically open trouble tickets when hosts first enter a problem state. |
| $LASTHOSTPROBLEMID$ | The previous (globally unique) problem number that was given to the host. Combined with event handlers, this macro could be used for automatically closing trouble tickets, etc. when a host recovers to an UP state. |
| $HOSTLATENCY$ | A (floating point) number indicating the number of seconds that a scheduled host check lagged behind its scheduled check time. For instance, if a check was scheduled for 03:14:15 and it didn't get executed until 03:14:17, there would be a check latency of 2.0 seconds. 按需地主机检测On-demand host checks have a latency of zero seconds. |
| $HOSTEXECUTIONTIME$ | A (floating point) number indicating the number of seconds that the host check took to execute (i.e. the amount of time the check was executing). |
| $HOSTDURATION$ | A string indicating the amount of time that the host has spent in its current state. Format is "XXh YYm ZZs", indicating hours, minutes and seconds. |
| $HOSTDURATIONSEC$ | A number indicating the number of seconds that the host has spent in its current state. |
| $HOSTDOWNTIME$ | A number indicating the current "downtime depth" for the host. If this host is currently in a period of scheduled downtime, the value will be greater than zero. If the host is not currently in a period of downtime, this value will be zero. |
| $HOSTPERCENTCHANGE$ | A (floating point) number indicating the percent state change the host has undergone. Percent state change is used by the flap detection algorithm. |
| $HOSTGROUPNAME$ | The short name of the hostgroup that this host belongs to. This value is taken from the hostgroup_name directive in the hostgroup definition. If the host belongs to more than one hostgroup this macro will contain the name of just one of them. |
| $HOSTGROUPNAMES$ | A comma separated list of the short names of all the hostgroups that this host belongs to. |
| $LASTHOSTCHECK$ | This is a timestamp in time_t format (seconds since the UNIX epoch) indicating the time at which a check of the host was last performed. |
| $LASTHOSTSTATECHANGE$ | This is a timestamp in time_t format (seconds since the UNIX epoch) indicating the time the host last changed state. |
| $LASTHOSTUP$ | This is a timestamp in time_t format (seconds since the UNIX epoch) indicating the time at which the host was last detected as being in an UP state. |
| $LASTHOSTDOWN$ | This is a timestamp in time_t format (seconds since the UNIX epoch) indicating the time at which the host was last detected as being in a DOWN state. |
| $LASTHOSTUNREACHABLE$ | This is a timestamp in time_t format (seconds since the UNIX epoch) indicating the time at which the host was last detected as being in an UNREACHABLE state. |
| $HOSTOUTPUT$ | The first line of text output from the last host check (i.e. "Ping OK"). |
| $LONGHOSTOUTPUT$ | The full text output (aside from the first line) from the last host check. |
| $HOSTPERFDATA$ | This macro contains any performance data that may have been returned by the last host check. |
| $HOSTCHECKCOMMAND$ | This macro contains the name of the command (along with any arguments passed to it) used to perform the host check. |
| $HOSTACKAUTHOR$8 | A string containing the name of the user who acknowledged the host problem. This macro is only valid in notifications where the $NOTIFICATIONTYPE$ macro is set to "ACKNOWLEDGEMENT". |
| $HOSTACKAUTHORNAME$8 | A string containing the short name of the contact (if applicable) who acknowledged the host problem. This macro is only valid in notifications where the $NOTIFICATIONTYPE$ macro is set to "ACKNOWLEDGEMENT". |
| $HOSTACKAUTHORALIAS$8 | A string containing the alias of the contact (if applicable) who acknowledged the host problem. This macro is only valid in notifications where the $NOTIFICATIONTYPE$ macro is set to "ACKNOWLEDGEMENT". |
| $HOSTACKCOMMENT$8 | A string containing the acknowledgement comment that was entered by the user who acknowledged the host problem. This macro is only valid in notifications where the $NOTIFICATIONTYPE$ macro is set to "ACKNOWLEDGEMENT". |
| $HOSTACTIONURL$ | Action URL for the host. This macro may contain other macros (e.g. $HOSTNAME$), which can be useful when you want to pass the host name to a web page. |
| $HOSTNOTESURL$ | Notes URL for the host. This macro may contain other macros (e.g. $HOSTNAME$), which can be useful when you want to pass the host name to a web page. |
| $HOSTNOTES$ | Notes for the host. This macro may contain other macros (e.g. $HOSTNAME$), which can be useful when you want to host-specific status information, etc. in the description. |
| $TOTALHOSTSERVICES$ | The total number of services associated with the host. |
| $TOTALHOSTSERVICESOK$ | The total number of services associated with the host that are in an OK state. |
| $TOTALHOSTSERVICESWARNING$ | The total number of services associated with the host that are in a WARNING state. |
| $TOTALHOSTSERVICESUNKNOWN$ | The total number of services associated with the host that are in an UNKNOWN state. |
| $TOTALHOSTSERVICESCRITICAL$ | The total number of services associated with the host that are in a CRITICAL state. |
表 8.14. 主机组宏:5
| $HOSTGROUPALIAS$5 | The long name / alias of either 1) the hostgroup name passed as an on-demand macro argument or 2) the primary hostgroup associated with the current host (if not used in the context of an on-demand macro). This value is taken from the alias directive in the hostgroup definition. |
| $HOSTGROUPMEMBERS$5 | A comma-separated list of all hosts that belong to either 1) the hostgroup name passed as an on-demand macro argument or 2) the primary hostgroup associated with the current host (if not used in the context of an on-demand macro). |
| $HOSTGROUPNOTES$5 | The notes associated with either 1) the hostgroup name passed as an on-demand macro argument or 2) the primary hostgroup associated with the current host (if not used in the context of an on-demand macro). This value is taken from the notes directive in the hostgroup definition. |
| $HOSTGROUPNOTESURL$5 | The notes URL associated with either 1) the hostgroup name passed as an on-demand macro argument or 2) the primary hostgroup associated with the current host (if not used in the context of an on-demand macro). This value is taken from the notes_url directive in the hostgroup definition. |
| $HOSTGROUPNOTES$5 | The action URL associated with either 1) the hostgroup name passed as an on-demand macro argument or 2) the primary hostgroup associated with the current host (if not used in the context of an on-demand macro). This value is taken from the action_url directive in the hostgroup definition. |
表 8.15. 服务宏:
| $SERVICEDESC$ | The long name/description of the service (i.e. "Main Website"). This value is taken from the description directive of the service definition. |
| $SERVICEDISPLAYNAME$ | An alternate display name for the service. This value is taken from the display_name directive in the service definition. |
| $SERVICESTATE$ | A string indicating the current state of the service ("OK", "WARNING", "UNKNOWN", or "CRITICAL"). |
| $SERVICESTATEID$ | A number that corresponds to the current state of the service: 0=OK, 1=WARNING, 2=CRITICAL, 3=UNKNOWN. |
| $LASTSERVICESTATE$ | A string indicating the last state of the service ("OK", "WARNING", "UNKNOWN", or "CRITICAL"). |
| $LASTSERVICESTATEID$ | A number that corresponds to the last state of the service: 0=OK, 1=WARNING, 2=CRITICAL, 3=UNKNOWN. |
| $SERVICESTATETYPE$ | A string indicating the state type for the current service check ("HARD" or "SOFT"). Soft states occur when service checks return a non-OK state and are in the process of being retried. Hard states result when service checks have been checked a specified maximum number of times. |
| $SERVICEATTEMPT$ | The number of the current service check retry. For instance, if this is the second time that the service is being rechecked, this will be the number two. Current attempt number is really only useful when writing service event handlers for "soft" states that take a specific action based on the service retry number. |
| $MAXSERVICEATTEMPTS$ | The max check attempts as defined for the current service. Useful when writing host event handlers for "soft" states that take a specific action based on the service retry number. |
| $SERVICEISVOLATILE$ | Indicates whether the service is marked as being volatile or not: 0 = not volatile, 1 = volatile. |
| $SERVICEEVENTID$ | A globally unique number associated with the service's current state. Every time a a service (or host) experiences a state change, a global event ID number is incremented by one (1). If a service has experienced no state changes, this macro will be set to zero (0). |
| $LASTSERVICEEVENTID$ | The previous (globally unique) event number that given to the service. |
| $SERVICEPROBLEMID$ | A globally unique number associated with the service's current problem state. Every time a service (or host) transitions from an OK or UP state to a problem state, a global problem ID number is incremented by one (1). This macro will be non-zero if the service is currently a non-OK state. State transitions between non-OK states (e.g. WARNING to CRITICAL) do not cause this problem id to increase. If the service is currently in an OK state, this macro will be set to zero (0). Combined with event handlers, this macro could be used to automatically open trouble tickets when services first enter a problem state. |
| $LASTSERVICEPROBLEMID$ | The previous (globally unique) problem number that was given to the service. Combined with event handlers, this macro could be used for automatically closing trouble tickets, etc. when a service recovers to an OK state. |
| $SERVICELATENCY$ | A (floating point) number indicating the number of seconds that a scheduled service check lagged behind its scheduled check time. For instance, if a check was scheduled for 03:14:15 and it didn't get executed until 03:14:17, there would be a check latency of 2.0 seconds. |
| $SERVICEEXECUTIONTIME$ | A (floating point) number indicating the number of seconds that the service check took to execute (i.e. the amount of time the check was executing). |
| $SERVICEDURATION$ | A string indicating the amount of time that the service has spent in its current state. Format is "XXh YYm ZZs", indicating hours, minutes and seconds. |
| $SERVICEDURATIONSEC$ | A number indicating the number of seconds that the service has spent in its current state. |
| $SERVICEDOWNTIME$ | A number indicating the current "downtime depth" for the service. If this service is currently in a period of scheduled downtime, the value will be greater than zero. If the service is not currently in a period of downtime, this value will be zero. |
| $SERVICEPERCENTCHANGE$ | A (floating point) number indicating the percent state change the service has undergone. Percent state change is used by the flap detection algorithm. |
| $SERVICEGROUPNAME$ | The short name of the servicegroup that this service belongs to. This value is taken from the servicegroup_name directive in the servicegroup definition. If the service belongs to more than one servicegroup this macro will contain the name of just one of them. |
| $SERVICEGROUPNAMES$ | A comma separated list of the short names of all the servicegroups that this service belongs to. |
| $LASTSERVICECHECK$ | This is a timestamp in time_t format (seconds since the UNIX epoch) indicating the time at which a check of the service was last performed. |
| $LASTSERVICESTATECHANGE$ | This is a timestamp in time_t format (seconds since the UNIX epoch) indicating the time the service last changed state. |
| $LASTSERVICEOK$ | This is a timestamp in time_t format (seconds since the UNIX epoch) indicating the time at which the service was last detected as being in an OK state. |
| $LASTSERVICEWARNING$ | This is a timestamp in time_t format (seconds since the UNIX epoch) indicating the time at which the service was last detected as being in a WARNING state. |
| $LASTSERVICEUNKNOWN$ | This is a timestamp in time_t format (seconds since the UNIX epoch) indicating the time at which the service was last detected as being in an UNKNOWN state. |
| $LASTSERVICECRITICAL$ | This is a timestamp in time_t format (seconds since the UNIX epoch) indicating the time at which the service was last detected as being in a CRITICAL state. |
| $SERVICEOUTPUT$ | The first line of text output from the last service check (i.e. "Ping OK"). |
| $LONGSERVICEOUTPUT$ | The full text output (aside from the first line) from the last service check. |
| $SERVICEPERFDATA$ | This macro contains any performance data that may have been returned by the last service check. |
| $SERVICECHECKCOMMAND$ | This macro contains the name of the command (along with any arguments passed to it) used to perform the service check. |
| $SERVICEACKAUTHOR$8 | A string containing the name of the user who acknowledged the service problem. This macro is only valid in notifications where the $NOTIFICATIONTYPE$ macro is set to "ACKNOWLEDGEMENT". |
| $SERVICEACKAUTHORNAME$8 | A string containing the short name of the contact (if applicable) who acknowledged the service problem. This macro is only valid in notifications where the $NOTIFICATIONTYPE$ macro is set to "ACKNOWLEDGEMENT". |
| $SERVICEACKAUTHORALIAS$8 | A string containing the alias of the contact (if applicable) who acknowledged the service problem. This macro is only valid in notifications where the $NOTIFICATIONTYPE$ macro is set to "ACKNOWLEDGEMENT". |
| $SERVICEACKCOMMENT$8 | A string containing the acknowledgement comment that was entered by the user who acknowledged the service problem. This macro is only valid in notifications where the $NOTIFICATIONTYPE$ macro is set to "ACKNOWLEDGEMENT". |
| $SERVICEACTIONURL$ | Action URL for the service. This macro may contain other macros (e.g. $HOSTNAME$ or $SERVICEDESC$), which can be useful when you want to pass the service name to a web page. |
| $SERVICENOTESURL$ | Notes URL for the service. This macro may contain other macros (e.g. $HOSTNAME$ or $SERVICEDESC$), which can be useful when you want to pass the service name to a web page. |
| $SERVICENOTES$ | Notes for the service. This macro may contain other macros (e.g. $HOSTNAME$ or $SERVICESTATE$), which can be useful when you want to service-specific status information, etc. in the description |
表 8.16. 服务组宏:6
| $SERVICEGROUPALIAS$6 | The long name / alias of either 1) the servicegroup name passed as an on-demand macro argument or 2) the primary servicegroup associated with the current service (if not used in the context of an on-demand macro). This value is taken from the alias directive in the servicegroup definition. |
| $SERVICEGROUPMEMBERS$6 | A comma-separated list of all services that belong to either 1) the servicegroup name passed as an on-demand macro argument or 2) the primary servicegroup associated with the current service (if not used in the context of an on-demand macro). |
| $SERVICEGROUPNOTES$6 | The notes associated with either 1) the servicegroup name passed as an on-demand macro argument or 2) the primary servicegroup associated with the current service (if not used in the context of an on-demand macro). This value is taken from the notes directive in the servicegroup definition. |
| $SERVICEGROUPNOTESURL$6 | The notes URL associated with either 1) the servicegroup name passed as an on-demand macro argument or 2) the primary servicegroup associated with the current service (if not used in the context of an on-demand macro). This value is taken from the notes_url directive in the servicegroup definition. |
| $SERVICEGROUPNOTES$6 | The action URL associated with either 1) the servicegroup name passed as an on-demand macro argument or 2) the primary servicegroup associated with the current service (if not used in the context of an on-demand macro). This value is taken from the action_url directive in the servicegroup definition. |
表 8.17. 联系人宏:
| $CONTACTNAME$ | Short name for the contact (i.e. "jdoe") that is being notified of a host or service problem. This value is taken from the contact_name directive in the contact definition. |
| $CONTACTALIAS$ | Long name/description for the contact (i.e. "John Doe") being notified. This value is taken from the alias directive in the contact definition. |
| $CONTACTEMAIL$ | Email address of the contact being notified. This value is taken from the email directive in the contact definition. |
| $CONTACTPAGER$ | Pager number/address of the contact being notified. This value is taken from the pager directive in the contact definition. |
| $CONTACTADDRESSn$ | Address of the contact being notified. Each contact can have six different addresses (in addition to email address and pager number). The macros for these addresses are $CONTACTADDRESS1$ - $CONTACTADDRESS6$. This value is taken from the addressx directive in the contact definition. |
| $CONTACTGROUPNAME$ | The short name of the contactgroup that this contact is a member of. This value is taken from the contactgroup_name directive in the contactgroup definition. If the contact belongs to more than one contactgroup this macro will contain the name of just one of them. |
| $CONTACTGROUPNAMES$ | A comma separated list of the short names of all the contactgroups that this contact is a member of. |
表 8.18. 联系人组宏:5
| $CONTACTGROUPALIAS$7 | The long name / alias of either 1) the contactgroup name passed as an on-demand macro argument or 2) the primary contactgroup associated with the current contact (if not used in the context of an on-demand macro). This value is taken from the alias directive in the contactgroup definition. |
| $CONTACTGROUPMEMBERS$7 | A comma-separated list of all contacts that belong to either 1) the contactgroup name passed as an on-demand macro argument or 2) the primary contactgroup associated with the current contact (if not used in the context of an on-demand macro). |
表 8.19. 汇总统计宏:
| $TOTALHOSTSUP$ | This macro reflects the total number of hosts that are currently in an UP state. |
| $TOTALHOSTSDOWN$ | This macro reflects the total number of hosts that are currently in a DOWN state. |
| $TOTALHOSTSUNREACHABLE$ | This macro reflects the total number of hosts that are currently in an UNREACHABLE state. |
| $TOTALHOSTSDOWNUNHANDLED$ | This macro reflects the total number of hosts that are currently in a DOWN state that are not currently being "handled". Unhandled host problems are those that are not acknowledged, are not currently in scheduled downtime, and for which checks are currently enabled. |
| $TOTALHOSTSUNREACHABLEUNHANDLED$ | This macro reflects the total number of hosts that are currently in an UNREACHABLE state that are not currently being "handled". Unhandled host problems are those that are not acknowledged, are not currently in scheduled downtime, and for which checks are currently enabled. |
| $TOTALHOSTPROBLEMS$ | This macro reflects the total number of hosts that are currently either in a DOWN or an UNREACHABLE state. |
| $TOTALHOSTPROBLEMSUNHANDLED$ | This macro reflects the total number of hosts that are currently either in a DOWN or an UNREACHABLE state that are not currently being "handled". Unhandled host problems are those that are not acknowledged, are not currently in scheduled downtime, and for which checks are currently enabled. |
| $TOTALSERVICESOK$ | This macro reflects the total number of services that are currently in an OK state. |
| $TOTALSERVICESWARNING$ | This macro reflects the total number of services that are currently in a WARNING state. |
| $TOTALSERVICESCRITICAL$ | This macro reflects the total number of services that are currently in a CRITICAL state. |
| $TOTALSERVICESUNKNOWN$ | This macro reflects the total number of services that are currently in an UNKNOWN state. |
| $TOTALSERVICESWARNINGUNHANDLED$ | This macro reflects the total number of services that are currently in a WARNING state that are not currently being "handled". Unhandled services problems are those that are not acknowledged, are not currently in scheduled downtime, and for which checks are currently enabled. |
| $TOTALSERVICESCRITICALUNHANDLED$ | This macro reflects the total number of services that are currently in a CRITICAL state that are not currently being "handled". Unhandled services problems are those that are not acknowledged, are not currently in scheduled downtime, and for which checks are currently enabled. |
| $TOTALSERVICESUNKNOWNUNHANDLED$ | This macro reflects the total number of services that are currently in an UNKNOWN state that are not currently being "handled". Unhandled services problems are those that are not acknowledged, are not currently in scheduled downtime, and for which checks are currently enabled. |
| $TOTALSERVICEPROBLEMS$ | This macro reflects the total number of services that are currently either in a WARNING, CRITICAL, or UNKNOWN state. |
| $TOTALSERVICEPROBLEMSUNHANDLED$ | This macro reflects the total number of services that are currently either in a WARNING, CRITICAL, or UNKNOWN state that are not currently being "handled". Unhandled services problems are those that are not acknowledged, are not currently in scheduled downtime, and for which checks are currently enabled. |
表 8.20. 通知宏:
表 8.21. 日期/时间宏:
| $LONGDATETIME$ | Current date/time stamp (i.e. Fri Oct 13 00:30:28 CDT 2000). Format of date is determined by date_format directive. |
| $SHORTDATETIME$ | Current date/time stamp (i.e. 10-13-2000 00:30:28). Format of date is determined by date_format directive. |
| $DATE$ | Date stamp (i.e. 10-13-2000). Format of date is determined by date_format directive. |
| $TIME$ | Current time stamp (i.e. 00:30:28). |
| $TIMET$ | Current time stamp in time_t format (seconds since the UNIX epoch). |
| $ISVALIDTIME:$9 | This is a special on-demand macro that returns a 1 or 0 depending on whether or not a particular time is valid within a specified timeperiod. There are two ways of using this macro:
|
| $NEXTVALIDTIME:$9 | This is a special on-demand macro that returns the next valid time (in time_t format) for a specified timeperiod. There are two ways of using this macro:
|
表 8.22. 文件宏:
| $MAINCONFIGFILE$ | The location of the main config file. |
| $STATUSDATAFILE$ | The location of the status data file. |
| $COMMENTDATAFILE$ | The location of the comment data file. |
| $DOWNTIMEDATAFILE$ | The location of the downtime data file. |
| $RETENTIONDATAFILE$ | The location of the retention data file. |
| $OBJECTCACHEFILE$ | The location of the object cache file. |
| $TEMPFILE$ | The location of the temp file. |
| $TEMPPATH$ | The directory specified by the temp path variable. |
| $LOGFILE$ | The location of the log file. |
| $RESOURCEFILE$ | The location of the resource file. |
| $COMMANDFILE$ | The location of the command file. |
| $HOSTPERFDATAFILE$ | The location of the host performance data file (if defined). |
| $SERVICEPERFDATAFILE$ | The location of the service performance data file (if defined). |
表 8.23. 其他宏:
| $PROCESSSTARTTIME$ | Time stamp in time_t format (seconds since the UNIX epoch) indicating when the Nagios process was last (re)started. You can determine the number of seconds that Nagios has been running (since it was last restarted) by subtracting $PROCESSSTARTTIME$ from $TIMET$. |
| $EVENTSTARTTIME$ | Time stamp in time_t format (seconds since the UNIX epoch) indicating when the Nagios process starting process events (checks, etc.). You can determine the number of seconds that it took for Nagios to startup by subtracting $PROCESSSTARTTIME$ from $EVENTSTARTTIME$. |
| $ADMINEMAIL$ | Global administrative email address. This value is taken from the admin_email directive. |
| $ADMINPAGER$ | 全局管理员的BP机号或地址,这个是从admin_pager域里取得的值。 |
| $ARGn$ | 指向第n个命令传递参数(通知、事件处理、服务检测等)。Nagios支持最多32个参数宏(从$ARG1$到$ARG32$)。 |
| $USERn$ | 指向第n个用户的宏。用户宏可以在资源文件里定义一个或多个。Nagios支持最多32个用户宏(从$USER1$到$USER32$)。 |
1当主机处于检测状态时与之相关的宏是无效的(如他们没有被检测也就还没有定性状态时);
2当服务处于检测状态时与之相关的宏是无效的(如他们没有被检测也就还没有定性状态时);
3当主机宏被用于服务相关命令时(如服务通知、事件处理等)主机宏被指向了与服务相关的主机;
4当主机与服务汇总统计宏被用于通知命令时,只是当联系人被授权的主机或服务被统计到汇总结果之中(如主机和服务配置以该联系人为通知接收人的情况);
5这些宏通常是指向当前主机所属的第一个(首要)主机组。很多情况下可被认为是一种主机宏。然而这些宏不能做为按需宏里的主机宏,当你用这些宏传主机组名时这些宏可被用做按需宏的主机组宏。如:$HOSTGROUPMEMBERS:hg1$将返回主机组hg1里的全部成员主机,是个以逗号分开的列表。
6这些宏通常是指向当前服务所属的第一个(首要)服务组。很多情况下可被认为是一种服务宏。然而这些宏不能做为按需宏里的服务宏,当你用这些宏传服务组名时这些宏可被用做按需宏的服务组宏。如:$SERVICEGROUPMEMBERS:sg1$将返回服务组sg1里的全部成员服务,是个以逗号分开的列表。
7这些宏通常是指向当前联系人所属的第一个(首要)联系人组。很多情况下可被认为是一种联系人宏。然而这些宏不能做为按需宏里的联系人宏,当你用这些宏传联系人名时这些宏可被用做按需宏的联系人宏。如:$CONTACTGROUPMEMBERS:cg1$将返回联系人组cg1里的全部成员联系人,是个以逗号分开的列表。
8尽量不使用这些宏。用更通用的宏$NOTIFICATIONAUTHOR$、$NOTIFICATIONAUTHORNAME$、$NOTIFICATIONAUTHORALIAS$或$NOTIFICATIONAUTHORCOMMENT$等宏替换。
9这些宏只用于按需宏 - 也就是说为了使用它们必须要提供额外的参数。这些宏在环境变量中不可用。
10汇总统计宏在当设置use_large_installation_tweaks选项使能时在环境变量中不可用,因为这将非常密集使用CPU来计算;
如果做过技术支持就会有过这种困惑,用户抱怨说“因特网不通了”而你却很抓狂。做为一个负责任的人,可以肯定的是没有人会拉掉网络供电电源,但是,由于用户在办公室上不了网却确实地存在。
如果是个技术性故障,可能会找寻故障问题所在。可能会重启动用户计算机,可能是用户的网线头没插好,也可能是核心路由器有点“抽风”。无论哪个问题,只有一个是肯定存在的 - 因特网不通。只是对那个用户而言因特网是不可达的。
Nagios具备判断所监控主机是否处于宕机还是不可达状态的能力。两个是很不同的状态(虽然它们是相关联的)并且可以帮助你快速地找到故障根源。下面是网络可达性逻辑如何来分辨两种状态的说明...
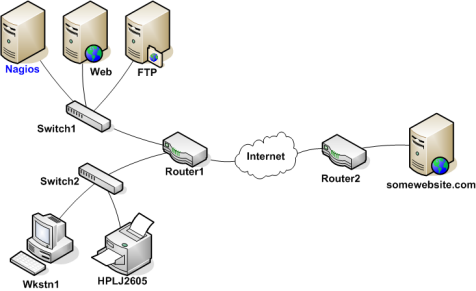
为使Nagios分辨出所监控主机所处于宕机还是不可达状态,必须要给出主机间的联接关系-联接关系要基于Nagios主守护程序所在点为根点。追踪每个从Nagios主守护程序到各自节点的数据包将可以得到这种关系。每个交换机、路由器和服务器上的数据包碰撞或通过都认为是网络拓扑中的一跳"hop",需要在Nagios里定义出主机间的父/子节点关系,下面给出例子中的网络在Nagios中的父/子关系视图:
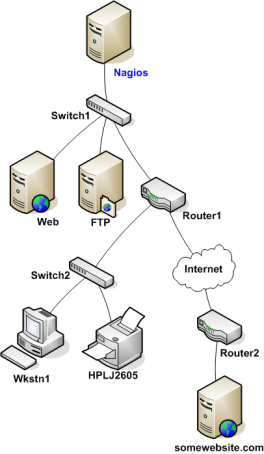
看图可以知道各个被监控主机的父/子节点关系了,但在Nagios的配置里如何来表达呢?可以用主机对象定义里面的parents域来实现。下面是例子中的对象定义的关于父/子节点关系的片段:
define host{
	host_name		Nagios   ; <-- The local host has no parent - it is the topmost host
	}
define host{
	host_name		Switch1
	parents		Nagios
	}
define host{
	host_name		Web
	parents		Switch1
	}
define host{
	host_name		FTP
	parents		Switch1
	}
define host{
	host_name		Router1
	parents		Switch1
	}
define host{
	host_name		Switch2
	parents		Router1
	}
define host{
	host_name		Wkstn1
	parents		Switch2
	}
define host{
	host_name		HPLJ2605
	parents		Switch2
	}
define host{
	host_name		Router2
	parents		Router1
	}
define host{
	host_name		somewebsite.com
	parents		Router2
	}
现在已经将主机的父/子逻辑关系正确地配置到了Nagios里,下面看一下当故障产生时会发生什么事。假定两个主机-Web与Router1-掉线了...
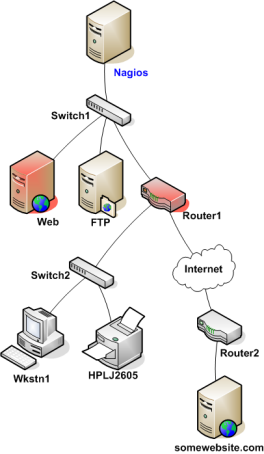
当主机状态改变(如从运行到宕机),Nagios唤起了网络可达性逻辑。可达性逻辑将初始化一个并发检测,只要是状态改变的主机的父/子节点都会被检测。在网络框架里变化发生时,这将使得Nagios迅速地对当前网络状态进行分析判定。
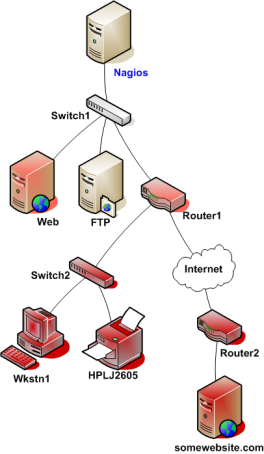
在本例中,Nagios将判定Web和Router1都处于宕机状态因为到达这两台主机的“路径”并没有阻塞。
Nagios将判定出在拓扑逻辑上Router1之下的所有主机处于不可达状态,因为Nagios无法找到它们。Router1的宕机将阻塞了到达这些主机的路径。这些主机可能运行得好着呢,也或是已经掉线-Nagios无法得知因为无法把测试包送达那里,因而Nagios认为那些主机是不可达而不是宕机。
Nagios has the ability to distinguish between "normal" services and "volatile" services. The is_volatile option in each service definition allows you to specify whether a specific service is volatile or not. For most people, the majority of all monitored services will be non-volatile (i.e. "normal"). However, volatile services can be very useful when used properly...
Volatile services are useful for monitoring...
- Things that automatically reset themselves to an "OK" state each time they are checked
- Events such as security alerts which require attention every time there is a problem (and not just the first time)
Volatile services differ from "normal" services in three important ways. Each time they are checked when they are in a hard non-OK state, and the check returns a non-OK state (i.e. no state change has occurred)...
- The non-OK service state is logged
- Contacts are notified about the problem (if that's what should be done). Note: Notification intervals are ignored for volatile services.
- The event handler for the service is run (if one has been defined)
These events normally only occur for services when they are in a non-OK state and a hard state change has just occurred. In other words, they only happen the first time that a service goes into a non-OK state. If future checks of the service result in the same non-OK state, no hard state change occurs and none of the events mentioned take place again.
Tip: If you are only interested in logging, consider using stalking options instead.
If you combine the features of volatile services and passive service checks, you can do some very useful things. Examples of this include handling SNMP traps, security alerts, etc.
How about an example... Let's say you're running PortSentry to detect port scans on your machine and automatically firewall potential intruders. If you want to let Nagios know about port scans, you could do the following...
Nagios Configuration:
- Create a service definition called Port Scans and associate it with the host that PortSentry is running on.
- Set the max_check_attempts directive in the service definition to 1. This will tell Nagios to immediate force the service into a hard state when a non-OK state is reported.
- Set the active_checks_enabled directive in the service definition to 0. This prevents Nagios from actively checking the service.
- Set the passive_checks_enabled directive in the service definition to 1. This enables passive checks for the service.
- Set this is_volatile directive in the service definition to 1.
PortSentry Configuration:
Edit your PortSentry configuration file (portsentry.conf) and define a command for the KILL_RUN_CMD directive as follows:
KILL_RUN_CMD="/usr/local/Nagios/libexec/eventhandlers/submit_check_result host_name 'Port Scans' 2 'Port scan from host $TARGET$ on port $PORT$. Host has been firewalled.'"
Make sure to replace host_name with the short name of the host that the service is associated with.
Port Scan Script:
Create a shell script in the /usr/local/nagios/libexec/eventhandlers directory named submit_check_result. The contents of the shell script should be something similiar to the following...
	#!/bin/sh
	# Write a command to the Nagios command file to cause
	# it to process a service check result
	echocmd="/bin/echo"
	CommandFile="/usr/local/nagios/var/rw/nagios.cmd"
	# get the current date/time in seconds since UNIX epoch
	datetime=`date +%s`
	# create the command line to add to the command file
	cmdline="[$datetime] PROCESS_SERVICE_CHECK_RESULT;$1;$2;$3;$4"
	# append the command to the end of the command file
	`$echocmd $cmdline >> $CommandFile`
What will happen when PortSentry detects a port scan on the machine in the future?
- PortSentry will firewall the host (this is a function of the PortSentry software)
- PortSentry will execute the submit_check_result shell script and send a passive check result to Nagios
- Nagios will read the external command file and see the passive service check submitted by PortSentry
- Nagios will put the Port Scans service in a hard CRITICAL state and send notifications to contacts
Pretty neat, huh?

Nagios有对主机和服务检测的结果"刷新"的特性。刷新检测的目的是为保证由外部应用而做的主机与服务强制检测可以正常提供结果数据。
Nagios定期地刷新全部的打开检测功能的主机与服务检测状态。
- 由每个主机或服务计算出一个刷新门限;
- 对于每个主机与服务,最后一次检测结果的时间长短会与刷新门限相比对;
- 如果最后一次检测结果的时间大于刷新检测门限,检测结果会被认为是"陈旧"的;
- 如果检测结果被认为是"陈旧的",Nagios将强制地针对该主机或服务用主机与服务对象定义里指定的命令来执行一次自主检测。
提示
例如,如果一个服务的刷新门限设定为60秒,Nagios将认为如果最后一次检测结果如果存在时间超过60秒将会认为该结果是"陈旧"的。
如果要打开刷新检测需要做如下事情:
- 在程序层面使能刷新检测要用check_service_freshness和check_host_freshness域来控制;
- 用service_freshness_check_interval和host_freshness_check_interval选项来设置Nagios以何频度来刷新主机和服务检测结果;
- 在主机与服务对象定义里打开主机的和服务的刷新检测开关,是设置对象里的check_freshness选项值为1;
- 配置主机和服务对象定义里的刷新检测门限,即设置对象里的freshness_threshold选项;
- 配置主机与服务对象定义里的check_command选项指向一个合法的可被用于自主检测的命令,当发现结果"陈旧"时可以使用该命令;
- 在主机与服务对象定义里的check_period选项可用于当Nagios认为需要进行一次刷新时可用时间周期,因而要保证它是一个合法的时间周期(译者注-在需要自主检测时刻可落入该时间周期定义);
提示
下面是一个可能需要刷新检测的服务样例,它是每天夜间做备份作业的服务。可能已经有一个外部脚在作业完成时向Nagios提交备份作业的结果。在这种情形下,全部的针对该服务的检测与结果将是由强制检测的外部应用来完成的。为保证每天的备份作业的状态都会被Nagios所收集报告,需要打开针对该服务的刷新检测。如果外部对备份作业的脚本没有提交检测结果,可以让Nagios取得一个紧急处置结果,象这样...
下面是该服务定义的样本(有些东西被省略了)...
define service{
	host_name		backup-server
	service_description	ArcServe Backup Job
	active_checks_enabled	0		; active checks are NOT enabled
	passive_checks_enabled	1		; passive checks are enabled (this is how results are reported)
	check_freshness		1
	freshness_threshold	93600		; 26 hour threshold, since backups may not always finish at the same time
	check_command		no-backup-report	; this command is run only if the service results are "stale"
	...other options...
	}
应该注意,该服务的自主检测是关闭的,这是因为该服务的检测是由外部应用使用强制检测机制送达Nagios。刷新检测打开了而且刷新门限设置为26小时。这个设置略长于备份作业每天所需要的24小时,因为备份作业每天时间长短不同(它是由多少数据量要做备份和当时的网络拥塞等等情况所决定)。设定的no-backup-report命令只是当服务检测结果被认为是"陈旧"的时候才执行的,这个no-backup-report命令的定义看起来象是这样:
define command{
	command_name	no-backup-report
	command_line	/usr/local/nagios/libexec/nobackupreport.sh
	}
这个nobackupreport.sh脚本放在/usr/local/nagios/libexec目录里,内容可能是这样的:
#!/bin/sh
/bin/echo "CRITICAL: Results of backup job were not reported!"
exit 2
如果Nagios检测到服务结果是"陈旧"的,它会以自主检测的方式来运行no-backup-report命令,也就是执行/usr/local/nagios/libexec/nobackupreport.sh脚本,它将给Nagios返回一个紧急状态。那么这个备份作业的服务就将处于紧急状态(如果它还不是紧急状态的话)同时相关人员可能会收到一个故障通知。
Nagios支持可选的发现主机与服务抖动的功能。当服务与主机状态改变过于频繁时会产生抖动,其结果产生了故障与恢复的通知风暴。抖动可能是由于配置的问题(如门限过低)、有毛病的服务或是真实的网络问题。
在此之前,我想说的是抖动的感知有点难实现。如何精确地确定网络与主机的什么叫做“过分频繁”?当我第一次考虑对感知抖动的实现时,我试图找到发现抖动本该或应该或是如何做的信息,但是一无所获,所以决定用一种对我言是一种合理的方式来解决它...
每当Nagios对主机与服务进行检测,它将查看该主机或服务是否已开始或停止抖动,条件有几条:
- 保存好的对主机与服务的检测结果至少21个;
- 分析历史检测结果确定状态变换发生了;
- 用状态转换判定主机与服务状态值改变的百分比;
- 比较这个百分比是否越过了设定的抖动门限的最低值与最高值;
认定主机与服务的抖动开始是它的状态改变率首次高于抖动门限的高限。
认定主机与服务的抖动结束是它的状态改变率低于抖动门限低限(前提是它已经处于抖动状态)。
下面用个服务来更详细地说明如何感知抖动的...
下图给出了最近21次检测结果的按时序的历史状态。正常(OK)态标记为绿色,告警(WARNING)态为黄色,紧急(CRITICAL)为红色,未知(UNKOWN)态为橙色。
对历史检测结果的检查决定了哪个时间里有状态变换发生,状态变换发生于存档状态与其前一次状态不同的时刻。由于用数组保存了最近21次检测结果,因而可以知道最多可能会产生20次变化。在本例中有7次状态变化,在图中上方用蓝色箭头示意出来。
感知状态抖动逻辑使用状态变换来判定整体服务的状态变化率,用于度量服务变化或更改的频度。没有发生过状态变化的变化率为0%,而每次都变化的状态变化率是100%。服务的状态变化应该在此之间变化。
当计算服务的状态变化率时,感知抖动的算法将会给对近期变化更多权重,旧的变化权重低。特别地,将近期变化给出50%的权重。图中示出对指定服务使用了近期变化有更多权重来计算整体变化率的情况。
利用图示结果,计算一下服务的状态变化率。共有7次状态变化(分别位于t3、t4、t5、t9、t12、t16和t19)。没有任何状态变化权重时结果将会是35%:
(7次查出的状态变化/20次最大状态变化次数)*100%=35%
因为感知抖动的检测逻辑使用近期变化更大的权重,所以该例中实际计算时变化率会低于35%。假定这个加权后的变化率是31%...
使用计算后的服务的状态变化率(31%)来比对抖动门限将会发生:
- 如果先前没有发生抖动且31%等于或超出了抖动门限的高限,Nagios将判定服务开始抖动;
- 如果服务先前处于抖动而且31%低于抖动门限的低限,Nagios将判定服务停止抖动;
如果两个都没有发生,感知抖动逻辑将不会对服务做任何动作,因为它既没有变为抖动也或许正在抖动。
主机的抖动感知与服务的相似,只是一个重要的不同:Nagios将在如下情形时尝试对其进行抖动中的检测:
- 主机检测时(自主检测或强制检测时都会做)
- 有时与主机绑定的服务被检测时。更特殊地,当至少x次的抖动感知做过时,此处的x等于全部与主机绑定服务的平均检测间隔时间。
为何要这样?由于最少的两次抖动检查次数间的时间最少是等于服务检测间隔时间。然而可能对主机的监控并非基于规格化的间隔,所以对主机的抖动检测可能对它的抖动感知的检查不是主机检测的间隔时间。同样地,要知道对服务的检查会叠加到主机的抖动感知检测上。毕竟服务是主机上的属性而不是别的...在种种检查速率相比之下,这个是最好的方式来多次地对主机进行抖动检查,所以你也得如此。
Nagios在抖动感知逻辑中用若干个值来判定状态变化率。既有主机的也有服务的,配置里面有全局的门限高限和低限也有专门针对主机的或是服务的门限。Nagios将在没有指定专门主机的或服务的门限时使用全局的门限值。
下表给出了全局的、专给主机的和专给服务的的门限值的控制变量。
通常Nagios将记录下针对主机和服务的最后21次检测结果用于抖动感知逻辑,而不管全部的检查结果。
提示
当服务或主机首次发现处于抖动时,Nagios将会:
- 记录下服务与主机正在抖动的信息;
- 给主机与服务增加一个非持续性的注释以说明它正在抖动;
- 给服务与主机相关的联系人发送一个"开始抖动"的通知;
- 压制主机与服务的其他通知(这个在通知逻辑中有一个过滤);
当服务或主机停止抖动时,Nagios将会:
- 记录下主机与服务停止了抖动;
- 删除最初的给主机与服务增加的开始抖动的注释;
- 给主机与服务相关的联系人送出一个"抖动停止"的通知;
- 停止阻塞该主机与服务的通知(通知转回到正常的通知逻辑)。
在Nagios打开抖动感知功能,需要如下设置:
- 将enable_flap_detection域设置为1;
- 在主机与服务对象定义中的flap_detection_enabled域设置为1;
如果想关闭全局的抖动感知功能,将enable_flap_detection域设置为0;
如果只想关闭一部分主机与服务的抖动检查,使用在主机与服务对象定义里flap_detection_enabled域来控制它;
Nagios支持对主机与服务所对应联系人通知的对象扩展。主机与服务中有关通知的对象扩展是由对象定义文件里的主机扩展对象和服务扩展对象来声明的。
注意
通知扩展将会且仅会在一个或多个扩展对象与当前要送出的通知相匹配时才做。如果主机与服务的通知与对象扩展不匹配任何一个合法的对象扩展,不会有主机或服务的对象扩展被应用于当前的通知过程中。见下面的例子:
define serviceescalation{
	host_name		webserver
	service_description	HTTP
	first_notification	3
	last_notification	5
	notification_interval	90
	contact_groups		nt-admins,managers
}
define serviceescalation{
	host_name		webserver
	service_description	HTTP
	first_notification	6
	last_notification	10
	notification_interval	60
	contact_groups		nt-admins,managers,everyone
}
要注意有一个通知的对象扩展定义的“孔洞”(空白区间)。也就是第1与第2个通知不会被扩展对象处理,对于超出10的通知也不会处理。对于第1和第2次通知,与全部的通知一样将使用服务对象里的默认联系人组里的联系人做对象通知。在例子中,假定服务对象定义里的默认的联系人组是名为nt-admins的联系人组。
当定义了通知相关的对象扩展,很重要的一点是要记得“低级别”对象扩展里的联系人组一定要出现在“高级别”对象扩展里的联系人组。这样才会确保每一个将要收到故障通知的人在故障不断扩张的情况下会持续地收到通知。例如:
define serviceescalation{
	host_name		webserver
	service_description	HTTP
	first_notification	3
	last_notification	5
	notification_interval	90
	contact_groups		nt-admins,managers
}
define serviceescalation{
	host_name		webserver
	service_description	HTTP
	first_notification	6
	last_notification	0
	notification_interval	60
	contact_groups		nt-admins,managers,everyone
}
第一个("低级别")档次的扩展包括了nt-admins和managers两个联系人组。后一个("高级别")档次的扩展包括了nt-admins、managers和everyone等三个联系人组。注意,nt-admins这个联系人组被包含在两个档次的扩展里,这样做可以使这个联系人组的成员可以在前两个通知送达后仍旧可以接到后序的通知。managers联系人组最初是在第一个档次("低级别")的扩展里出现-里面的成员会在第三个通知开始送出时收到通知。肯定是希望managers组里的联系人可持续地收到之后的通知(如果第5次故障通知还在的话),因而这个组也加到了第2("高级别")档次的扩展定义里了。
关于通知的对象扩展可以被覆盖,见下面的例子:
define serviceescalation{
	host_name		webserver
	service_description	HTTP
	first_notification	3
	last_notification	5
	notification_interval	20
	contact_groups		nt-admins,managers
}
define serviceescalation{
	host_name		webserver
	service_description	HTTP
	first_notification	4
	last_notification	0
	notification_interval	30
	contact_groups		on-call-support
}
在上例中,
- nt-admins和managers两个联系人组将在第3次通知开始时收到通知;
- 全部的三个联系人组将在第4和第5次通知时收到通知;
- 仅仅是on-call-support联系人组会在第6次及之后的通知送出时收到通知。
当通知被扩展的时候,恢复通知会因故障通知状态不同而稍有不同,见下例:
define serviceescalation{
	host_name		webserver
	service_description	HTTP
	first_notification	3
	last_notification	5
	notification_interval	20
	contact_groups		nt-admins,managers
}
define serviceescalation{
	host_name		webserver
	service_description	HTTP
	first_notification	4
	last_notification	0
	notification_interval	30
	contact_groups		on-call-support
}
如果在第3次故障通知之后服务检测后要送出一个恢复通知,那么谁会收到通知?事实上,这个恢复通知应该算是第4个通知,然而Nagios的通知扩展代码会“聪明地判断出”其实只有收到第3次通知的联系人组才应该收到这个恢复通知。这时,nt-admins和managers联系人组将收到这个恢复通知。(译者注:那个on-call-support组里的联系人不会收到!)
还可以修改对指定主机与服务通知的送出频度,用主机扩展与服务扩展对象定义里的notification_interval域来指定不同的频度。如下例:
define serviceescalation{
	host_name		webserver
	service_description	HTTP
	first_notification	3
	last_notification	5
	notification_interval	45
	contact_groups		nt-admins,managers
}
define serviceescalation{
	host_name		webserver
	service_description	HTTP
	first_notification	6
	last_notification	0
	notification_interval	60
	contact_groups		nt-admins,managers,everyone
}
这个例子中,这个服务的默认通知送出间隔是240分钟(该值是在服务对象定义里设置的)。当该服务的通知被扩展到第3、第4和第5次时,每次通知的间隔将是45分钟。在第6次及之后,通知间隔将变成60分钟,这个是在第2个的服务扩展对象里定义的。
既然主机与服务的对象扩展有可能覆盖,而且某个主机事实上有可能从属于多个主机组,那么Nagios就不得不就在通知间隔有覆盖的情况下取哪个通知间隔做个决定。当对于一个服务通知存在有多个合法有效的对象扩展定义时,Nagios将会取其中最小的通知间隔来做为间隔。见下例:
define serviceescalation{
	host_name		webserver
	service_description	HTTP
	first_notification	3
	last_notification	5
	notification_interval	45
	contact_groups		nt-admins,managers
}
define serviceescalation{
	host_name		webserver
	service_description	HTTP
	first_notification	4
	last_notification	0
	notification_interval	60
	contact_groups		nt-admins,managers,everyone
}
该例中有针对第4和第5次通知,有两个对象扩展相互覆盖。这两次通知间隔里,Nagios的通知间隔将是45分钟,因为当这几次通知要送出时在现有的合法有效的服务对象扩展里这个值最小。
define serviceescalation{
	host_name		webserver
	service_description	HTTP
	first_notification	3
	last_notification	5
	notification_interval	45
	contact_groups		nt-admins,managers
}
define serviceescalation{
	host_name		webserver
	service_description	HTTP
	first_notification	4
	last_notification	6
	notification_interval	0
	contact_groups		nt-admins,managers,everyone
}
define serviceescalation{
	host_name		webserver
	service_description	HTTP
	first_notification	7
	last_notification	0
	notification_interval	30
	contact_groups		nt-admins,managers
}
在上例中,故障通知的最大次数是在4。这是因为第二档次的服务对象扩展里的通知间隔值是0,因而(当第4次通知将要被送出时)只会送出一个通知而之后通知被抑制。因此,在第4次通知送出后第三个服务扩展对象无论如何也不会起作用了。
通常的情况下,对通知的对象扩展可以用于任意想要送出主机与服务通知的时刻。这个"通知时间窗口"取决于主机与服务对象定义里的notification_period域值。
可以用主机扩展与对象扩展里的escalation_period域来指定一个特定时间周期使得扩展被限定只处于某个特定时间段内。使用escalation_period域来指定某个时间周期里对象扩展是可用的,对象扩展将只是在指定的时间里可用。如果没有在escalation_period域里指定时间周期,主机扩展与服务扩展将会在"通知时间窗口"内的任意时间里是可用的。
注意
Admins often have to shoulder the burden of answering pagers, cell phone calls, etc. when they least desire them. No one likes to be woken up at 4 am to fix a problem. But its often better to fix the problem in the middle of the night, rather than face the wrath of an unhappy boss when you stroll in at 9 am the next morning.
For those lucky admins who have a team of gurus who can help share the responsibility of answering alerts, on-call rotations are often setup. Multiple admins will often alternate taking notifications on weekends, weeknights, holidays, etc.
I'll show you how you can create timeperiod definitions in a way that can facilitate most on-call notification rotations. These definitions won't handle human issues that will inevitably crop up (admins calling in sick, swapping shifts, or throwing their pagers into the river), but they will allow you to setup a basic structure that should work the majority of the time.
Two admins - John and Bob - are responsible for responding to Nagios alerts. John receives all notifications for weekdays (and weeknights) - except for holidays - and Bob gets handles notifications during the weekends and holidays. Lucky Bob. Here's how you can define this type of rotation using timeperiods...
First, define a timeperiod that contains time ranges for holidays:
例 8.1.
define timeperiod{
name holidays
timeperiod_name holidays
january 1 00:00-24:00 ; New Year's Day
2007-03-23 00:00-24:00 ; Easter (2008)
2007-04-12 00:00-24:00 ; Easter (2009)
monday -1 may 00:00-24:00 ; Memorial Day (Last Monday in May)
july 4 00:00-24:00 ; Independence Day
monday 1 september 00:00-24:00 ; Labor Day (1st Monday in September)
thursday 4 november 00:00-24:00 ; Thanksgiving (4th Thursday in November)
december 25 00:00-24:00 ; Christmas
december 31 17:00-24:00 ; New Year's Eve (5pm onwards)
}
Next, define a timeperiod for John's on-call times that include weekdays and weeknights, but excludes the dates/times defined in the holidays timeperiod above:
例 8.2.
define timeperiod{
timeperiod_name john-oncall
monday 00:00-24:00
tuesday 00:00-24:00
wednesday 00:00-24:00
thursday 00:00-24:00
friday 00:00-24:00
exclude holidays ; Exclude holiday dates/times defined elsewhere
}
You can now reference this timeperiod in John's contact definition:
例 8.3.
define contact{
contact_name john
...
host_notification_period john-oncall
service_notification_period john-oncall
}
Define a new timeperiod for Bob's on-call times that include weekends and the dates/times defined in the holidays timeperiod above:
例 8.4.
define timeperiod{
timeperiod_name bob-oncall
friday 00:00-24:00
saturday 00:00-24:00
use holidays ; Also include holiday date/times defined elsewhere
}
You can now reference this timeperiod in Bob's contact definition:
例 8.5.
define contact{
contact_name bob
...
host_notification_period bob-oncall
service_notification_period bob-oncall
}
In this scenario John and Bob alternate handling alerts every other day - regardless of whether its a weekend, weekday, or holiday.
Define a timeperiod for when John should receive notifications. Assuming today's date is August 1st, 2007 and John is handling notifications starting today, the definition would look like this:
例 8.6.
define timeperiod{
timeperiod_name john-oncall
2007-08-01 / 2 00:00-24:00 ; Every two days, starting August 1st, 2007
}
Now define a timeperiod for when Bob should receive notifications. Bob gets notifications on the days that John doesn't, so his first on-call day starts tomorrow (August 2nd, 2007).
例 8.7.
define timeperiod{
timeperiod_name bob-oncall
2007-08-02 / 2 00:00-24:00 ; Every two days, starting August 2nd, 2007
}
Now you need to reference these timeperiod definitions in the contact definitions for John and Bob:
例 8.8.
define contact{
contact_name john
...
host_notification_period john-oncall
service_notification_period john-oncall
}
例 8.9.
define contact{
contact_name bob
...
host_notification_period bob-oncall
service_notification_period bob-oncall
}
In this scenario John and Bob alternate handling alerts every other week. John handles alerts Sunday through Saturday one week, and Bob handles alerts for the following seven days. This continues in perpetuity.
Define a timeperiod for when John should receive notifications. Assuming today's date is Sunday, July 29th, 2007 and John is handling notifications this week (starting today), the definition would look like this:
例 8.10.
define timeperiod{
timeperiod_name john-oncall
2007-07-29 / 14 00:00-24:00 ; Every 14 days (two weeks), starting Sunday, July 29th, 2007
2007-07-30 / 14 00:00-24:00 ; Every other Monday starting July 30th, 2007
2007-07-31 / 14 00:00-24:00 ; Every other Tuesday starting July 31st, 2007
2007-08-01 / 14 00:00-24:00 ; Every other Wednesday starting August 1st, 2007
2007-08-02 / 14 00:00-24:00 ; Every other Thursday starting August 2nd, 2007
2007-08-03 / 14 00:00-24:00 ; Every other Friday starting August 3rd, 2007
2007-08-04 / 14 00:00-24:00 ; Every other Saturday starting August 4th, 2007
}
Now define a timeperiod for when Bob should receive notifications. Bob gets notifications on the weeks that John doesn't, so his first on-call day starts next Sunday (August 8th, 2007).
例 8.11.
define timeperiod{
timeperiod_name bob-oncall
2007-08-05 / 14 00:00-24:00 ; Every 14 days (two weeks), starting Sunday, August 5th, 2007
2007-08-06 / 14 00:00-24:00 ; Every other Monday starting August 6th, 2007
2007-08-07 / 14 00:00-24:00 ; Every other Tuesday starting August 7th, 2007
2007-08-08 / 14 00:00-24:00 ; Every other Wednesday starting August 8th, 2007
2007-08-09 / 14 00:00-24:00 ; Every other Thursday starting August 9th, 2007
2007-08-10 / 14 00:00-24:00 ; Every other Friday starting August 10th, 2007
2007-08-11 / 14 00:00-24:00 ; Every other Saturday starting August 11th, 2007
}
Now you need to reference these timeperiod definitions in the contact definitions for John and Bob:
例 8.12.
define contact{
contact_name john
...
host_notification_period john-oncall
service_notification_period john-oncall
}
例 8.13.
define contact{
contact_name bob
...
host_notification_period bob-oncall
service_notification_period bob-oncall
}
In this scenarios, John handles notifications for all days except those he has off. He has several standing days off each month, as well as some planned vacations. Bob handles notifications when John is on vacation or out of the office.
First, define a timeperiod that contains time ranges for John's vacation days and days off:
例 8.14.
define timeperiod{
name john-out-of-office
timeperiod_name john-out-of-office
day 15 00:00-24:00 ; 15th day of each month
day -1 00:00-24:00 ; Last day of each month (28th, 29th, 30th, or 31st)
day -2 00:00-24:00 ; 2nd to last day of each month (27th, 28th, 29th, or 30th)
january 2 00:00-24:00 ; January 2nd each year
june 1 - july 5 00:00-24:00 ; Yearly camping trip (June 1st - July 5th)
2007-11-01 - 2007-11-10 00:00-24:00 ; Vacation to the US Virgin Islands (November 1st-10th, 2007)
}
Next, define a timeperiod for John's on-call times that excludes the dates/times defined in the timeperiod above:
例 8.15.
define timeperiod{
timeperiod_name john-oncall
monday 00:00-24:00
tuesday 00:00-24:00
wednesday 00:00-24:00
thursday 00:00-24:00
friday 00:00-24:00
exclude john-out-of-office ; Exclude dates/times John is out
}
You can now reference this timeperiod in John's contact definition:
例 8.16.
define contact{
contact_name john
...
host_notification_period john-oncall
service_notification_period john-oncall
}
Define a new timeperiod for Bob's on-call times that include the dates/times that John is out of the office:
例 8.17.
define timeperiod{
timeperod_name bob-oncall
use john-out-of-office ; Include holiday date/times that John is out
}
You can now reference this timeperiod in Bob's contact definition:
例 8.18.
define contact{
contact_name bob
...
host_notification_period bob-oncall
service_notification_period bob-oncall
}
There are a lot of other on-call notification rotation scenarios that you might have. The date exception directive in timeperiod definitions is capable of handling most dates and date ranges that you might need to use, so check out the different formats that you can use. If you make a mistake when creating timeperiod definitions, always err on the side of giving someone else more on-call duty time. :-)
服务依赖的几个基本点:
- 服务可以依赖于一个或多个其他服务;
- 服务可以依赖于绑定于不同主机上的服务;
- 服务依赖是不被继承的(除非专门配置过);
- 服务领事可被用于在不同的状态情况(正常、告警、未知和紧急)下引发服务检测的执行和服务通知的抑制;
- 服务依赖可能只是在指定时间周期内合法。
首先做为基础。应在对象配置文件里创建服务依赖对象定义。每个服务依赖定义要指定依赖于哪个服务, 作为被依赖的服务的选取标准是当其失效时会引发执行与通知动作(下面会解释)。
可以给一个服务创建多个服务依赖,但必须要给每个依赖创建各自独立的依赖依赖对象。
下图中给出一个服务通知与执行依赖的逻辑示意,不同服务依赖于其他服务的通知和检测执行。
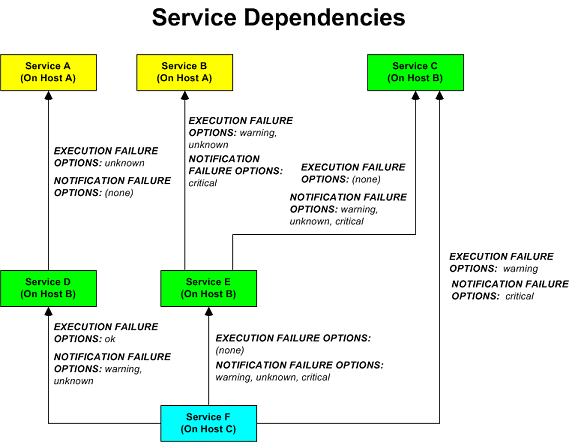
在这个例子中,在Host C主机上的Service F的服务依赖将被定义成这样:
define servicedependency{
	host_name			Host B
	service_description		Service D
	dependent_host_name		Host C
	dependent_service_description	Service F
	execution_failure_criteria	o
	notification_failure_criteria	w,u
}
define servicedependency{
	host_name			Host B
	service_description		Service E
	dependent_host_name		Host C
	dependent_service_description	Service F
	execution_failure_criteria	n
	notification_failure_criteria	w,u,c
}
define servicedependency{
	host_name			Host B
	service_description		Service C
	dependent_host_name		Host C
	dependent_service_description	Service F
	execution_failure_criteria	w
	notification_failure_criteria	c
}
在图中的其他服务依赖将被定义成这样:
define servicedependency{
	host_name			Host A
	service_description		Service A
	dependent_host_name		Host B
	dependent_service_description	Service D
	execution_failure_criteria	u
	notification_failure_criteria	n
}
define servicedependency{
	host_name			Host A
	service_description		Service B
	dependent_host_name		Host B
	dependent_service_description	Service E
	execution_failure_criteria	w,u
	notification_failure_criteria	c
}
define servicedependency{
	host_name			Host B
	service_description		Service C
	dependent_host_name		Host B
	dependent_service_description	Service E
	execution_failure_criteria	n
	notification_failure_criteria	w,u,c
}
在Nagios进行一个服务的检测或是送出该服务的通知之前,将会查看该服务是否有服务依赖。如果没有,那么象正常情况一样做做检测或送出服务通知。如果该服务存在一个或多个服务依赖,Nagios将会如下方式来检查每个服务依赖:
- Nagios将取出给定的当前*服务依赖的服务状况;
- Nagios用当前有服务依赖的服务状态去比对依赖对象定义(里面有关时间的设置)里所给出的执行或通知失效的选项;
- 如果当前有服务依赖的服务状态匹配中其中一个失效选项,依赖就失效并会中断依赖检测的逻辑循环;
- 如果当前有服务依赖的服务状态没有匹配中任何一个失效选项,依赖检查通过并且Nagios将继续运行并检查下一个依赖入口;
这个检测循环会继续直到全部的服务依赖都检查完成或是其中一个服务依赖的失效选项被命中。
注意
注:*重要的是,默认情况下,Nagios在进行依赖检查时将会使用该服务的最近的硬态状态所匹配的服务依赖。如果想让Nagios使用最近的状态(不管是软态状态还是硬态状态)来做服务的依赖匹配,需要使能soft_state_dependencies选项。当服务的主动检测将要被执行时可以用实施服务依赖来限制它,强制检测并不会被实施服务依赖所限制。
If all of the execution dependency tests for the service passed, Nagios will execute the check of the service as it normally would. If even just one of the execution dependencies for a service fails, Nagios will temporarily prevent the execution of checks for that (dependent) service. At some point in the future the execution dependency tests for the service may all pass. If this happens, Nagios will start checking the service again as it normally would. More information on the check scheduling logic can be found here.
In the example above, Service E would have failed execution dependencies if Service B is in a WARNING or UNKNOWN state. If this was the case, the service check would not be performed and the check would be scheduled for (potential) execution at a later time.
If all of the notification dependency tests for the service passed, Nagios will send notifications out for the service as it normally would. If even just one of the notification dependencies for a service fails, Nagios will temporarily repress notifications for that (dependent) service. At some point in the future the notification dependency tests for the service may all pass. If this happens, Nagios will start sending out notifications again as it normally would for the service. More information on the notification logic can be found here.
In the example above, Service F would have failed notification dependencies if Service C is in a CRITICAL state, and/orService D is in a WARNING or UNKNOWN state, and/or if Service E is in a WARNING, UNKNOWN, or CRITICAL state. If this were the case, notifications for the service would not be sent out.
As mentioned before, service dependencies are not inherited by default. In the example above you can see that Service F is dependent on Service E. However, it does not automatically inherit Service E's dependencies on Service B and Service C. In order to make Service F dependent on Service C we had to add another service dependency definition. There is no dependency definition for Service B, so Service F is not dependent on Service B.
If you do wish to make service dependencies inheritable, you must use the inherits_parent directive in the service dependency definition. When this directive is enabled, it indicates that the dependency inherits dependencies of the service that is being depended upon (also referred to as the master service). In other words, if the master service is dependent upon other services and any one of those dependencies fail, this dependency will also fail.
In the example above, imagine that you want to add a new dependency for service F to make it dependent on service A. You could create a new dependency definition that specified service F as the dependent service and service A as being the master service (i.e. the service that is being dependend on). You could alternatively modify the dependency definition for services D and F to look like this:
define servicedependency{
	host_name			Host B
	service_description		Service D
	dependent_host_name		Host C
	dependent_service_description	Service F
	execution_failure_criteria	o
	notification_failure_criteria	n
	inherits_parent		1
}
Since the inherits_parent directive is enabled, the dependency between services A and D will be tested when the dependency between services F and D are being tested.
Dependencies can have multiple levels of inheritence. If the dependency definition between A and D had its inherits_parent directive enable and service A was dependent on some other service (let's call it service G), the service F would be dependent on services D, A, and G (each with potentially different criteria).
As you'd probably expect, host dependencies work in a similiar fashion to service dependencies. The difference is that they're for hosts, not services.
Tip: Do not confuse host dependencies with parent/child host relationships. You should be using parent/child host relationships (defined with the parents directive in host definitions) for most cases, rather than host dependencies. A description of how parent/child host relationships work can be found in the documentation on network reachability.
Here are the basics about host dependencies:
- A host can be dependent on one or more other host
- Host dependencies are not inherited (unless specifically configured to)
- Host dependencies can be used to cause host check execution and host notifications to be suppressed under different circumstances (UP, DOWN, and/or UNREACHABLE states)
- Host dependencies might only be valid during specific timeperiods
The image below shows an example of the logical layout of host notification dependencies. Different hosts are dependent on other hosts for notifications.

In the example above, the dependency definitions for Host C would be defined as follows:
define hostdependency{
	host_name			Host A
	dependent_host_name		Host C
	notification_failure_criteria	d
}
define hostdependency{
	host_name			Host B
	dependent_host_name		Host C
	notification_failure_criteria	d,u
}
As with service dependencies, host dependencies are not inherited. In the example image you can see that Host C does not inherit the host dependencies of Host B. In order for Host C to be dependent on Host A, a new host dependency definition must be defined.
Host notification dependencies work in a similiar manner to service notification dependencies. If all of the notification dependency tests for the host pass, Nagios will send notifications out for the host as it normally would. If even just one of the notification dependencies for a host fails, Nagios will temporarily repress notifications for that (dependent) host. At some point in the future the notification dependency tests for the host may all pass. If this happens, Nagios will start sending out notifications again as it normally would for the host. More information on the notification logic can be found here.
主机和服务的依赖关系(从属关系、上下级关系)的定义可令你在执行检测时和在进行告警送出时拥有更大的控制力。一旦在监控过程中运用了关系定义,非常重要的是确保在依赖关系逻辑之上的状态信息保持同步,越新越好。
在它决定是否要送出报警或是允许对主机或服务进行自主检测时,Nagios允许你在进行针对主机和服务的依赖检测前做些准备以确认依赖逻辑将是最新的状态信息。
下图示意了一个被Nagios监控的主机组图,包含它们的父子节点关系及依赖关系定义。
图例中的Switch2主机刚好从运行状态到出问题的状态。Nagios需要判断主机是否是宕机或是不可达,因而它会运行并行检测针对Switch2的直接父节点(Firewall1)和子节点(Comp1、Comp2和Switch3)。这个是主机可达性检查函数的一般逻辑。
你或许注意到了Switch2是依赖于Monitor1和File1以进行告警和执行检测(这点在本例中并不重要)。如果主机依赖检测准备使能的话,Nagios将会在针对Switch2的直接父节检测的同时针对Monitor1和File1进行并行检测。Nagios这样做是因为很快就必须进行的依赖逻辑检查(例如需要告警)并且将要确保在依赖关系逻辑之中的与主机关系的部分的信息是最新的。
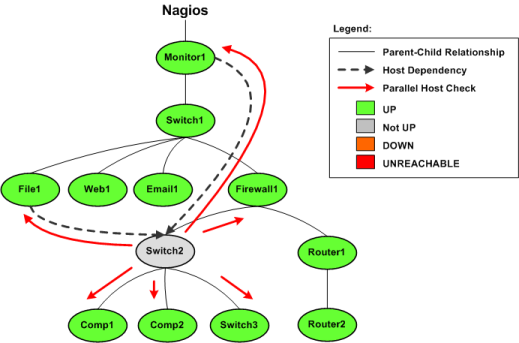
这就是进行的依赖检测前准备工作,很简单,不是么?
注意
服务依赖检测前的准备工作与之类似,只不过是把针对主机替换成针对服务。
依赖检测的准备涉及上面很少的部分,所以我推荐你打开这个功能。在许多情况下,拥有在依赖逻辑上的准确状态信息比过多地进行检测更具意义。
使能依赖检测准备很简单:
- 针对主机的依赖检测准备由enable_predictive_host_dependency_checks选项控制。
- 针对服务的依赖检测准备由enable_predictive_service_dependency_checks选项控制。
Nagios is designed to allow plugins to return optional performance data in addition to normal status data, as well as allow you to pass that performance data to external applications for processing. A description of the different types of performance data, as well as information on how to go about processing that data is described below...
There are two basic categories of performance data that can be obtained from Nagios:
- Check performance data
- Plugin performance data
Check performance data is internal data that relates to the actual execution of a host or service check. This might include things like service check latency (i.e. how "late" was the service check from its scheduled execution time) and the number of seconds a host or service check took to execute. This type of performance data is available for all checks that are performed. The $HOSTEXECUTIONTIME$ and $SERVICEEXECUTIONTIME$macros can be used to determine the number of seconds a host or service check was running and the $HOSTLATENCY$ and $SERVICELATENCY$ macros can be used to determine how "late" a regularly-scheduled host or service check was.
Plugin performance data is external data specific to the plugin used to perform the host or service check. Plugin-specific data can include things like percent packet loss, free disk space, processor load, number of current users, etc. - basically any type of metric that the plugin is measuring when it executes. Plugin-specific performance data is optional and may not be supported by all plugins. Plugin-specific performance data (if available) can be obtained by using the $HOSTPERFDATA$ and $SERVICEPERFDATA$macros. Read on for more information on how plugins can return performance data to Nagios for inclusion in the $HOSTPERFDATA$ and $SERVICEPERFDATA$ macros.
At a minimum, Nagios plugins must return a single line of human-readable text that indicates the status of some type of measurable data. For example, the check_ping plugin might return a line of text like the following:
With this simple type of output, the entire line of text is available in the $HOSTOUTPUT$ or $SERVICEOUTPUT$ macros (depending on whether this plugin was used as a host check or service check).
Plugins can return optional performance data in their output by sending the normal, human-readable text string that they usually would, followed by a pipe character (|), and then a string containing one or more performance data metrics. Let's take the check_ping plugin as an example and assume that it has been enhanced to return percent packet loss and average round trip time as performance data metrics. Sample output from the plugin might look like this:
When Nagios sees this plugin output format it will split the output into two parts:
- Everything before the pipe character is considered to be the "normal" plugin output and will be stored in either the $HOSTOUTPUT$ or $SERVICEOUTPUT$ macro
- Everything after the pipe character is considered to be the plugin-specific performance data and will be stored in the $HOSTPERFDATA$ or $SERVICEPERFDATA$ macro
In the example above, the $HOSTOUTPUT$ or $SERVICEOUTPUT$ macro would contain "PING ok - Packet loss = 0%, RTA = 0.80 ms" (without quotes) and the $HOSTPERFDATA$ or $SERVICEPERFDATA$ macro would contain "percent_packet_loss=0, rta=0.80" (without quotes).
Multiple lines of performace data (as well as normal text output) can be obtained from plugins, as described in the plugin API documentation.
Note: The Nagios daemon doesn't directly process plugin performance data, so it doesn't really care what the performance data looks like. There aren't really any inherent limitations on the format or content of the performance data. However, if you are using an external addon to process the performance data (i.e. PerfParse), the addon may be expecting that the plugin returns performance data in a specific format. Check the documentation that comes with the addon for more information.
If you want to process the performance data that is available from Nagios and the plugins, you'll need to do the following:
- Enable the process_performance_data option.
- Configure Nagios so that performance data is either written to files and/or processed by executing commands.
Read on for information on how to process performance data by writing to files or executing commands.
The most flexible way to process performance data is by having Nagios execute commands (that you specify) to process or redirect the data for later processing by external applications. The commands that Nagios executes to process host and service performance data are determined by the host_perfdata_command and service_perfdata_command options, respectively.
An example command definition that redirects service check performance data to a text file for later processing by another application is shown below:
例 8.21.
define command{
command_name store-service-perfdata
command_line /bin/echo -e "$LASTSERVICECHECK$\t$HOSTNAME$\t$SERVICEDESC$\t$SERVICESTATE$\t$SERVICEATTEMPT$\t$SERVICESTATETYPE$\t$SERVICEEXECUTIONTIME$\t$SERVICELATENCY$\t$SERVICEOUTPUT$\t$SERVICEPERFDATA$" >> /usr/local/nagios/var/service-perfdata.dat
}
Tip: This method, while flexible, comes with a relatively high CPU overhead. If you're processing performance data for a large number of hosts and services, you'll probably want Nagios to write performance data to files instead. This method is described in the next section.
You can have Nagios write all host and service performance data directly to text files using the host_perfdata_file and service_perfdata_file options. The format in which host and service performance data is written to those files is determined by the host_perfdata_file_template and service_perfdata_file_template options.
An example file format template for service performance data might look like this:
例 8.22.
By default, the text files will be opened in "append" mode. If you need to change the modes to "write" or "non-blocking read/write" (useful when writing to pipes), you can use the host_perfdata_file_mode and service_perfdata_file_mode options.
Additionally, you can have Nagios periodically execute commands to periocially process the performance data files (e.g. rotate them) using the host_perfdata_file_processing_command and service_perfdata_file_processing_command options. The interval at which these commands are executed are governed by the host_perfdata_file_processing_interval and service_perfdata_file_processing_interval options, respectively.
跟标准的监控程序不一样,Nagios可以做些很有趣的事情。与其花费时间玩Quake,为何不花点时间看看这个http://www.nagios.org/docs/hacks...
Nagios can be configured to support distributed monitoring of network services and resources. I'll try to briefly explan how this can be accomplished...
The goal in the distributed monitoring environment that I will describe is to offload the overhead (CPU usage, etc.) of performing service checks from a "central" server onto one or more "distributed" servers. Most small to medium sized shops will not have a real need for setting up such an environment. However, when you want to start monitoring hundreds or even thousands of hosts (and several times that many services) using Nagios, this becomes quite important.
The diagram below should help give you a general idea of how distributed monitoring works with Nagios. I'll be referring to the items shown in the diagram as I explain things...
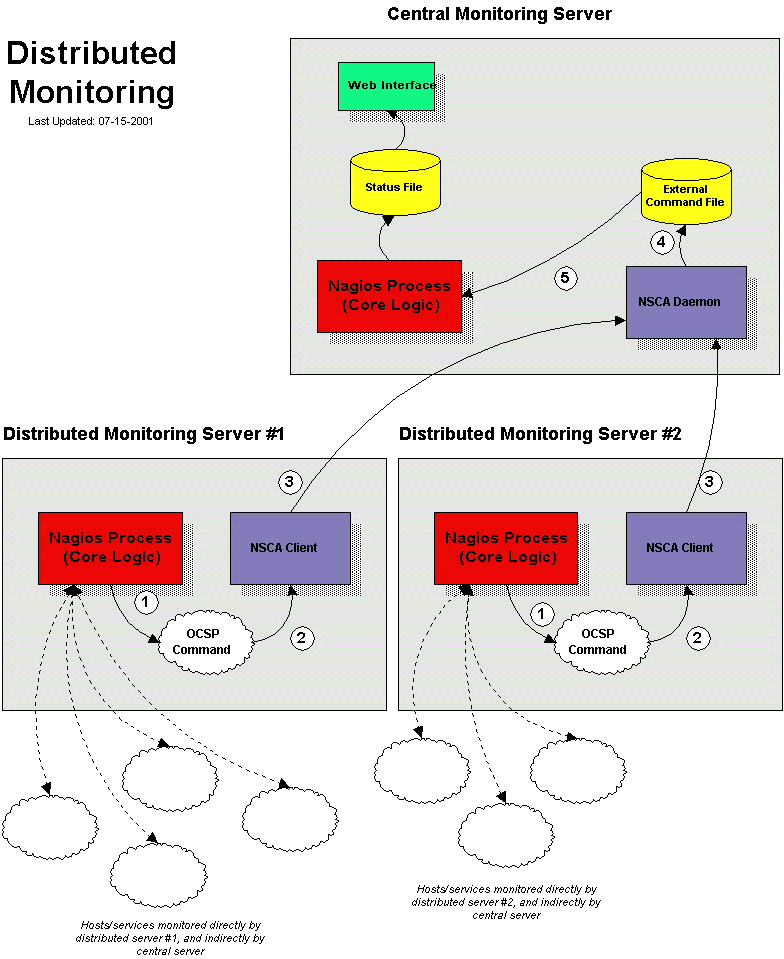
When setting up a distributed monitoring environment with Nagios, there are differences in the way the central and distributed servers are configured. I'll show you how to configure both types of servers and explain what effects the changes being made have on the overall monitoring. For starters, lets describe the purpose of the different types of servers...
The function of a distributed server is to actively perform checks all the services you define for a "cluster" of hosts. I use the term "cluster" loosely - it basically just mean an arbitrary group of hosts on your network. Depending on your network layout, you may have several cluters at one physical location, or each cluster may be separated by a WAN, its own firewall, etc. The important thing to remember to that for each cluster of hosts (however you define that), there is one distributed server that runs Nagios and monitors the services on the hosts in the cluster. A distributed server is usually a bare-bones installation of Nagios. It doesn't have to have the web interface installed, send out notifications, run event handler scripts, or do anything other than execute service checks if you don't want it to. More detailed information on configuring a distributed server comes later...
The purpose of the central server is to simply listen for service check results from one or more distributed servers. Even though services are occassionally actively checked from the central server, the active checks are only performed in dire circumstances, so lets just say that the central server only accepts passive check for now. Since the central server is obtaining passive service check results from one or more distributed servers, it serves as the focal point for all monitoring logic (i.e. it sends out notifications, runs event handler scripts, determines host states, has the web interface installed, etc).
Okay, before we go jumping into configuration detail we need to know how to send the service check results from the distributed servers to the central server. I've already discussed how to submit passive check results to Nagios from same host that Nagios is running on (as described in the documentation on passive checks), but I haven't given any info on how to submit passive check results from other hosts.
In order to facilitate the submission of passive check results to a remote host, I've written the nsca addon. The addon consists of two pieces. The first is a client program (send_nsca) which is run from a remote host and is used to send the service check results to another server. The second piece is the nsca daemon (nsca) which either runs as a standalone daemon or under inetd and listens for connections from client programs. Upon receiving service check information from a client, the daemon will sumbit the check information to Nagios (on the central server) by inserting a PROCESS_SVC_CHECK_RESULT command into the external command file, along with the check results. The next time Nagios checks for external commands, it will find the passive service check information that was sent from the distributed server and process it. Easy, huh?
So how exactly is Nagios configured on a distributed server? Basically, its just a bare-bones installation. You don't need to install the web interface or have notifications sent out from the server, as this will all be handled by the central server.
Key configuration changes:
- Only those services and hosts which are being monitored directly by the distributed server are defined in the object configuration file.
- The distributed server has its enable_notifications directive set to 0. This will prevent any notifications from being sent out by the server.
- The distributed server is configured to obsess over services.
- The distributed server has an ocsp command defined (as described below).
In order to make everything come together and work properly, we want the distributed server to report the results of all service checks to Nagios. We could use event handlers to report changes in the state of a service, but that just doesn't cut it. In order to force the distributed server to report all service check results, you must enabled the obsess_over_services option in the main configuration file and provide a ocsp_command to be run after every service check. We will use the ocsp command to send the results of all service checks to the central server, making use of the send_nsca client and nsca daemon (as described above) to handle the tranmission.
In order to accomplish this, you'll need to define an ocsp command like this:
ocsp_command=submit_check_result
The command definition for the submit_check_result command looks something like this:
define command{
	command_name	submit_check_result
	command_line	/usr/local/nagios/libexec/eventhandlers/submit_check_result $HOSTNAME$ '$SERVICEDESC$' $SERVICESTATE$ '$SERVICEOUTPUT$'
	}
The submit_check_result shell scripts looks something like this (replace central_server with the IP address of the central server):
#!/bin/sh
	# Arguments:
	#  $1 = host_name (Short name of host that the service is
	#       associated with)
	#  $2 = svc_description (Description of the service)
	#  $3 = state_string (A string representing the status of
	#       the given service - "OK", "WARNING", "CRITICAL"
	#       or "UNKNOWN")
	#  $4 = plugin_output (A text string that should be used
	#       as the plugin output for the service checks)
	#

	# Convert the state string to the corresponding return code
	return_code=-1

	case "$3" in
    		    OK)
        	    return_code=0
            	        ;;
	        WARNING)
    	            return_code=1
        	        ;;
	        CRITICAL)
    	            return_code=2
        	        ;;
	        UNKNOWN)
    	            return_code=-1
        	        ;;
	esac
	# pipe the service check info into the send_nsca program, which
	# in turn transmits the data to the nsca daemon on the central
	# monitoring server

	/bin/printf "%s\t%s\t%s\t%s\n" "$1" "$2" "$return_code" "$4" | /usr/local/nagios/bin/send_nsca central_server -c /usr/local/nagios/etc/send_nsca.cfg
The script above assumes that you have the send_nsca program and it configuration file (send_nsca.cfg) located in the /usr/local/nagios/bin/ and /usr/local/nagios/etc/ directories, respectively.
That's it! We've sucessfully configured a remote host running Nagios to act as a distributed monitoring server. Let's go over exactly what happens with the distributed server and how it sends service check results to Nagios (the steps outlined below correspond to the numbers in the reference diagram above):
- After the distributed server finishes executing a service check, it executes the command you defined by the ocsp_command variable. In our example, this is the /usr/local/nagios/libexec/eventhandlers/submit_check_result script. Note that the definition for the submit_check_result command passed four pieces of information to the script: the name of the host the service is associated with, the service description, the return code from the service check, and the plugin output from the service check.
- The submit_check_result script pipes the service check information (host name, description, return code, and output) to the send_nsca client program.
- The send_nsca program transmits the service check information to the nsca daemon on the central monitoring server.
- The nsca daemon on the central server takes the service check information and writes it to the external command file for later pickup by Nagios.
- The Nagios process on the central server reads the external command file and processes the passive service check information that originated from the distributed monitoring server.
We've looked at hot distributed monitoring servers should be configured, so let's turn to the central server. For all intensive purposes, the central is configured as you would normally configure a standalone server. It is setup as follows:
- The central server has the web interface installed (optional, but recommended)
- The central server has its enable_notifications directive set to 1. This will enable notifications. (optional, but recommended)
- The central server has active service checks disabled (optional, but recommended - see notes below)
- The central server has external command checks enabled (required)
- The central server has passive service checks enabled (required)
There are three other very important things that you need to keep in mind when configuring the central server:
- The central server must have service definitions for all services that are being monitored by all the distributed servers. Nagios will ignore passive check results if they do not correspond to a service that has been defined.
- If you're only using the central server to process services whose results are going to be provided by distributed hosts, you can simply disable all active service checks on a program-wide basis by setting the execute_service_checks directive to 0. If you're using the central server to actively monitor a few services on its own (without the aid of distributed servers), the enable_active_checks option of the defintions for service being monitored by distributed servers should be set to 0. This will prevent Nagios from actively checking those services.
It is important that you either disable all service checks on a program-wide basis or disable the enable_active_checks option in the definitions for each service that is monitored by a distributed server. This will ensure that active service checks are never executed under normal circumstances. The services will keep getting rescheduled at their normal check intervals (3 minutes, 5 minutes, etc...), but the won't actually be executed. This rescheduling loop will just continue all the while Nagios is running. I'll explain why this is done in a bit...
That's it! Easy, huh?
For all intensive purposes we can say that the central server is relying solely on passive checks for monitoring. The main problem with relying completely on passive checks for monitoring is the fact that Nagios must rely on something else to provide the monitoring data. What if the remote host that is sending in passive check results goes down or becomes unreachable? If Nagios isn't actively checking the services on the host, how will it know that there is a problem?
Fortunately, there is a way we can handle these types of problems...
Nagios supports a feature that does "freshness" checking on the results of service checks. More information freshness checking can be found here. This features gives some protection against situations where remote hosts may stop sending passive service checks into the central monitoring server. The purpose of "freshness" checking is to ensure that service checks are either being provided passively by distributed servers on a regular basis or performed actively by the central server if the need arises. If the service check results provided by the distributed servers get "stale", Nagios can be configured to force active checks of the service from the central monitoring host.
So how do you do this? On the central monitoring server you need to configure services that are being monitoring by distributed servers as follows...
- The check_freshness option in the service definitions should be set to 1. This enables "freshness" checking for the services.
- The freshness_threshold option in the service definitions should be set to a value (in seconds) which reflects how "fresh" the results for the services (provided by the distributed servers) should be.
- The check_command option in the service definitions should reflect valid commands that can be used to actively check the service from the central monitoring server.
Nagios periodically checks the "freshness" of the results for all services that have freshness checking enabled. The freshness_threshold option in each service definition is used to determine how "fresh" the results for each service should be. For example, if you set this value to 300 for one of your services, Nagios will consider the service results to be "stale" if they're older than 5 minutes (300 seconds). If you do not specify a value for the freshness_threshold option, Nagios will automatically calculate a "freshness" threshold by looking at either the normal_check_interval or retry_check_interval options (depending on what type of state the service is in). If the service results are found to be "stale", Nagios will run the service check command specified by the check_command option in the service definition, thereby actively checking the service.
Remember that you have to specify a check_command option in the service definitions that can be used to actively check the status of the service from the central monitoring server. Under normal circumstances, this check command is never executed (because active checks were disabled on a program-wide basis or for the specific services). When freshness checking is enabled, Nagios will run this command to actively check the status of the service even if active checks are disabled on a program-wide or service-specific basis.
If you are unable to define commands to actively check a service from the central monitoring host (or if turns out to be a major pain), you could simply define all your services with the check_command option set to run a dummy script that returns a critical status. Here's an example... Let's assume you define a command called 'service-is-stale' and use that command name in the check_command option of your services. Here's what the definition would look like...
define command{
	command_name	service-is-stale
	command_line	/usr/local/nagios/libexec/staleservice.sh
	}
The staleservice.sh script in your /usr/local/nagios/libexec directory might look something like this:
#!/bin/sh
/bin/echo "CRITICAL: Service results are stale!"
exit 2
When Nagios detects that the service results are stale and runs the service-is-stale command, the /usr/local/nagios/libexec/staleservice.sh script is executed and the service will go into a critical state. This would likely cause notifications to be sent out, so you'll know that there's a problem.
At this point you know how to obtain service check results passivly from distributed servers. This means that the central server is not actively checking services on its own. But what about host checks? You still need to do them, so how?
Since host checks usually compromise a small part of monitoring activity (they aren't done unless absolutely necessary), I'd recommend that you perform host checks actively from the central server. That means that you define host checks on the central server the same way that you do on the distributed servers (and the same way you would in a normal, non-distributed setup).
Passive host checks are available (read here), so you could use them in your distributed monitoring setup, but they suffer from a few problems. The biggest problem is that Nagios does not translate passive host check problem states (DOWN and UNREACHABLE) when they are processed. This means that if your monitoring servers have a different parent/child host structure (and they will, if you monitoring servers are in different locations), the central monitoring server will have an inaccurate view of host states.
If you do want to send passive host checks to a central server in your distributed monitoring setup, make sure:
- The central server has passive host checks enabled (required)
- The distributed server is configured to obsess over hosts.
- The distributed server has an ochp command defined.
The ochp command, which is used for processing host check results, works in a similiar manner to the ocsp command, which is used for processing service check results (see documentation above). In order to make sure passive host check results are up to date, you'll want to enable freshness checking for hosts (similiar to what is described above for services).
This section describes a few scenarios for implementing redundant monitoring hosts an various types of network layouts. With redundant hosts, you can maintain the ability to monitor your network when the primary host that runs Nagios fails or when portions of your network become unreachable.
Note: If you are just learning how to use Nagios, I would suggest not trying to implement redudancy until you have becoming familiar with the prerequisites I've laid out. Redundancy is a relatively complicated issue to understand, and even more difficult to implement properly.
Prerequisites
Before you can even think about implementing redundancy with Nagios, you need to be familiar with the following...
- Implementing event handlers for hosts and services
- Issuing external commands to Nagios via shell scripts
- Executing plugins on remote hosts using either the NRPE addon or some other method
- Checking the status of the Nagios process with the check_nagios plugin
Sample Scripts
All of the sample scripts that I use in this documentation can be found in the eventhandlers/ subdirectory of the Nagios distribution. You'll probably need to modify them to work on your system...
Scenario 1 - Redundant Monitoring
Introduction
This is an easy (and naive) method of implementing redundant monitoring hosts on your network and it will only protect against a limited number of failures. More complex setups are necessary in order to provide smarter redundancy, better redundancy across different network segments, etc.
Goals
The goal of this type of redundancy implementation is simple. Both the "master" and "slave" hosts monitor the same hosts and service on the network. Under normal circumstances only the "master" host will be sending out notifications to contacts about problems. We want the "slave" host running Nagios to take over the job of notifying contacts about problems if:
- The "master" host that runs Nagios is down or..
- The Nagios process on the "master" host stops running for some reason
Network Layout Diagram
The diagram below shows a very simple network setup. For this scenario I will be assuming that hosts A and E are both running Nagios and are monitoring all the hosts shown. Host A will be considered the "master" host and host E will be considered the "slave" host.
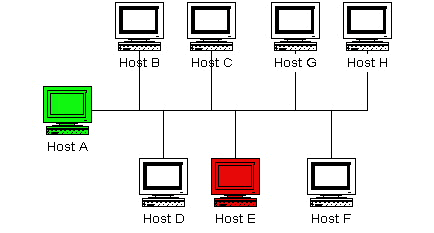
Initial Program Settings
The slave host (host E) has its initial enable_notifications directive disabled, thereby preventing it from sending out any host or service notifications. You also want to make sure that the slave host has its check_external_commands directive enabled. That was easy enough...
Initial Configuration
Next we need to consider the differences between the object configuration file(s) on the master and slave hosts...
I will assume that you have the master host (host A) setup to monitor services on all hosts shown in the diagram above. The slave host (host E) should be setup to monitor the same services and hosts, with the following additions in the configuration file...
- The host definition for host A (in the host E configuration file) should have a host event handler defined. Lets say the name of the host event handler is handle-master-host-event.
- The configuration file on host E should have a service defined to check the status of the Nagios process on host A. Lets assume that you define this service check to run the check_nagios plugin on host A. This can be done by using one of the methods described in this FAQ (update this!).
- The service definition for the Nagios process check on host A should have an event handler defined. Lets say the name of the service event handler is handle-master-proc-event.
It is important to note that host A (the master host) has no knowledge of host E (the slave host). In this scenario it simply doesn't need to. Of course you may be monitoring services on host E from host A, but that has nothing to do with the implementation of redundancy...
Event Handler Command Definitions
We need to stop for a minute and describe what the command definitions for the event handlers on the slave host look like. Here is an example...
例 9.1. define command{ command_name handle-master-host-event command_line /usr/local/nagios/libexec/eventhandlers/handle-master-host-event $HOSTSTATE$ $HOSTSTATETYPE$ } define command{ command_name handle-master-proc-event command_line /usr/local/nagios/libexec/eventhandlers/handle-master-proc-event $SERVICESTATE$ $SERVICESTATETYPE$ }
This assumes that you have placed the event handler scripts in the /usr/local/nagios/libexec/eventhandlers directory. You may place them anywhere you wish, but you'll need to modify the examples I've given here.
Event Handler Scripts
Okay, now lets take a look at what the event handler scripts look like...
Host Event Handler (handle-master-host-event):
#!/bin/sh
# Only take action on hard host states...
case "$2" in
HARD)
	case "$1" in
	DOWN)
		# The master host has gone down!
		# We should now become the master host and take
		# over the responsibilities of monitoring the
		# network, so enable notifications...
		/usr/local/nagios/libexec/eventhandlers/enable_notifications
		;;
	UP)
		# The master host has recovered!
		# We should go back to being the slave host and
		# let the master host do the monitoring, so
		# disable notifications...
		/usr/local/nagios/libexec/eventhandlers/disable_notifications
		;;
	esac
	;;
esac
exit 0
Service Event Handler (handle-master-proc-event):
#!/bin/sh
# Only take action on hard service states...
case "$2" in
HARD)
	case "$1" in
	CRITICAL)
		# The master Nagios process is not running!
		# We should now become the master host and
		# take over the responsibility of monitoring
		# the network, so enable notifications...
		/usr/local/nagios/libexec/eventhandlers/enable_notifications
		;;
	WARNING)
	UNKNOWN)
		# The master Nagios process may or may not
		# be running.. We won't do anything here, but
		# to be on the safe side you may decide you
		# want the slave host to become the master in
		# these situations...
		;;
	OK)
		# The master Nagios process running again!
		# We should go back to being the slave host,
		# so disable notifications...
		/usr/local/nagios/libexec/eventhandlers/disable_notifications
		;;
	esac
	;;
esac
exit 0
What This Does For Us
The slave host (host E) initially has notifications disabled, so it won't send out any host or service notifications while the Nagios process on the master host (host A) is still running.
The Nagios process on the slave host (host E) becomes the master host when...
- The master host (host A) goes down and the handle-master-host-event host event handler is executed.
- The Nagios process on the master host (host A) stops running and the handle-master-proc-event service event handler is executed.
When the Nagios process on the slave host (host E) has notifications enabled, it will be able to send out notifications about any service or host problems or recoveries. At this point host E has effectively taken over the responsibility of notifying contacts of host and service problems!
The Nagios process on host E returns to being the slave host when...
- Host A recovers and the handle-master-host-event host event handler is executed.
- The Nagios process on host A recovers and the handle-master-proc-event service event handler is executed.
When the Nagios process on host E has notifications disabled, it will not send out notifications about any service or host problems or recoveries. At this point host E has handed over the responsibilities of notifying contacts of problems to the Nagios process on host A. Everything is now as it was when we first started!
Time Lags
Redundancy in Nagios is by no means perfect. One of the more obvious problems is the lag time between the master host failing and the slave host taking over. This is affected by the following...
- The time between a failure of the master host and the first time the slave host detects a problem
- The time needed to verify that the master host really does have a problem (using service or host check retries on the slave host)
- The time between the execution of the event handler and the next time that Nagios checks for external commands
You can minimize this lag by...
- Ensuring that the Nagios process on host E (re)checks one or more services at a high frequency. This is done by using the check_interval and retry_interval arguments in each service definition.
- Ensuring that the number of host rechecks for host A (on host E) allow for fast detection of host problems. This is done by using the max_check_attempts argument in the host definition.
- Increase the frequency of external command checks on host E. This is done by modifying the command_check_interval option in the main configuration file.
When Nagios recovers on the host A, there is also some lag time before host E returns to being a slave host. This is affected by the following...
- The time between a recovery of host A and the time the Nagios process on host E detects the recovery
- The time between the execution of the event handler on host B and the next time the Nagios process on host E checks for external commands
The exact lag times between the transfer of monitoring responsibilities will vary depending on how many services you have defined, the interval at which services are checked, and a lot of pure chance. At any rate, its definitely better than nothing.
Special Cases
Here is one thing you should be aware of... If host A goes down, host E will have notifications enabled and take over the responsibilities of notifying contacts of problems. When host A recovers, host E will have notifications disabled. If - when host A recovers - the Nagios process on host A does not start up properly, there will be a period of time when neither host is notifying contacts of problems! Fortunately, the service check logic in Nagios accounts for this. The next time the Nagios process on host E checks the status of the Nagios process on host A, it will find that it is not running. Host E will then have notifications enabled again and take over all responsibilities of notifying contacts of problems.
The exact amount of time that neither host is monitoring the network is hard to determine. Obviously, this period can be minimized by increasing the frequency of service checks (on host E) of the Nagios process on host A. The rest is up to pure chance, but the total "blackout" time shouldn't be too bad.
Scenario 2 - Failover Monitoring
Introduction
Failover monitoring is similiar to, but slightly different than redundant monitoring (as discussed above in scenario 1).
Goals
The basic goal of failover monitoring is to have the Nagios process on the slave host sit idle while the Nagios process on the master host is running. If the process on the master host stops running (or if the host goes down), the Nagios process on the slave host starts monitoring everything.
While the method described in scenario 1 will allow you to continue receive notifications if the master monitoring hosts goes down, it does have some pitfalls. The biggest problem is that the slave host is monitoring the same hosts and servers as the master at the same time as the master! This can cause problems with excessive traffic and load on the machines being monitored if you have a lot of services defined. Here's how you can get around that problem...
Initial Program Settings
Disable active service checks and notifications on the slave host using the execute_service_checks and enable_notifications directives. This will prevent the slave host from monitoring hosts and services and sending out notifications while the Nagios process on the master host is still up and running. Make sure you also have the check_external_commands directive enabled on the slave host.
Master Process Check
Set up a cron job on the slave host that periodically (say every minute) runs a script that checks the staus of the Nagios process on the master host (using the check_nrpe plugin on the slave host and the nrpe daemon and check_nagios plugin on the master host). The script should check the return code of the check_nrpe plugin . If it returns a non-OK state, the script should send the appropriate commands to the external command file to enable both notifications and active service checks. If the plugin returns an OK state, the script should send commands to the external command file to disable both notifications and active checks.
By doing this you end up with only one process monitoring hosts and services at a time, which is much more efficient that monitoring everything twice.
Also of note, you don't need to define host and service handlers as mentioned in scenario 1 because things are handled differently.
Additional Issues
At this point, you have implemented a very basic failover monitoring setup. However, there is one more thing you should consider doing to make things work smoother.
The big problem with the way things have been setup thus far is the fact that the slave host doesn't have the current status of any services or hosts at the time it takes over the job of monitoring. One way to solve this problem is to enable the ocsp command on the master host and have it send all service check results to the slave host using the nsca addon. The slave host will then have up-to-date status information for all services at the time it takes over the job of monitoring things. Since active service checks are not enabled on the slave host, it will not actively run any service checks. However, it will execute host checks if necessary. This means that both the master and slave hosts will be executing host checks as needed, which is not really a big deal since the majority of monitoring deals with service checks.
That's pretty much it as far as setup goes.
用户在使用Nagios大型安装模式将会有许多好处,使用use_large_installation_tweaks配置选项。使能这个选项将使Nagios守护程序将进行某些短路以使系统负载更低且性能最好。
当你在主配置文件中使能了use_large_installation_tweaks配置选项,将会使Nagios守护进行做如下变化:
- 在环境中不能使用汇总类的宏-汇总宏在环境中将不能使用。这些宏的计算在大型安装时会非常地集中消耗时间,因此它们在此时是不能使用的。但如果你在脚本中传递这些参数时,这些汇总性的宏仍旧可用于规格化的宏而加入脚本。
- 内存清理有所不同-通常Nagios在子进程退出时会释放子进程分配的内存,这是个好习惯,然后在许多安装模式下并不需要,因为许多操作系统将会很小心地处理进程退出时的内存。操作系统倾向于自主地释放内存而不是由Nagios来做,这样更快,因而Nagios不再试图释放子进程的内存空间,如果你使能了这个配置选项的话。
- 派生fork()检查更少-通过Nagios会在主机和服务检测时做两次派生。这样做是因为(1)确保受阻的插件有一个较高的进程等级捕获错误信号或进入异常;(2)让操作系统来对那些退出子进程的下级进程做清除处理。额外的派生并不是真有必要,所以在你使能这个配置选项后它会跳过额外派生动作。Nagios将自行清理子进程的退出(而不是等到操作系统来做它)这使得Nagios在这种安装模式下显著地降低负载。

应用了缓存检测机制可以显著地改善Nagios监控逻辑的性能。缓存检测的作用是,当Nagios发现可以利用最近一次检查结果来替代这次检测时,Nagios会放弃执行一次主机与服务的检测。
应用缓存检测机制对于通常的规格化编制的主机与服务检测的性能不会有明显改善。缓存检测只是对于主机与服务的按需检测的性能有显著改善。预定的计划性检测可以确保主机与服务的状态更新规范化,它使得在不久的将来,它的检查结果最有可能被缓存检测所利用。
作为参考,要做主机的按需检测...
- 当绑定于主机上的服务状态发生了变更;
- 部分检查内容由于需要做主机可达性逻辑判断;
- 部分是由于需要做主机依赖性检测的前处理。
要做服务的按需检测...
- 是由于需要做服务依赖性检测的前处理。
注意
当Nagios需要做一个主机与服务的按需检测时,它将做一个判定,是否要利用缓存检测结果还是要真的去用插件来做一次检查。这取决于这次主机与服务的最近一次检测结果是否发生于最近的X分钟之内,这里X是缓存主机与服务结果的时间长度。
如果最近一次检测的时间刚好在指定缓存检测结果的时间内,Nagios将会利用最近一次针对该主机与服务检测结果而不会真的去做一次检测。如果该主机与服务的检测没有做过,或是最近一次检测结果的时间超出缓存检测的时间深度,Nagios将会用插件对该主机与服务来做一次新的真正的检查。
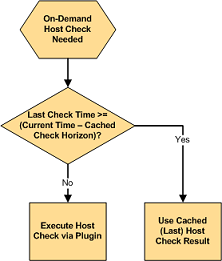
Nagios做按需检测是由于它认为有必要及时地知道该主机与服务在那一时间里的状态。利用缓存检测结果将使得Nagios可以认为最近一次检测结果是"足够好用"的当前主机与服务的状态,并且认定真的没有必要再去做一次该主机与服务的重检测。
缓存检测的时间深度告诉Nagios在多长的时间内检测的结果是值得信赖地反应出了当前的主机或服务的状态。比如,时间深度设置是30秒,那么在最近的30秒之内的主机与服务的检测结果就可以被认为是当前的主机与服务的状态结果。
Nagios的可用缓存结果数量与需要执行按需检测次数之比被认为是缓存检测的“击中率”。增加缓存检测的时间深度直到该值等于规格化检测的时间间隔,在理论上可以实现缓存检测的击中率到100%。在这种情况下,全部的按需检测都可以从缓存检测的结果中提取,多高的性能改善啊!但是真的么?可能并非如此!
缓存检测结果信息的可信度随时间而降低。高的缓冲击中率需要加长认定为"合法"结果的缓存时间。但各种网络场景变换很快,而且没有任何可以担保在30秒之前处于正常状态的服务当前也是处于正常的。因而不得不取个折中-信任度与速度之间取折中。如果要提高缓存结果的时间深度,就不得不要冒着缓存结果应用于监控逻辑之中信任度降低的风险。
Nagios将最终判定出全部主机与服务的正确的状态,因此即便在缓存中的检测结果相对于其真实情况有可能是不可信的,Nagios也只是会在一个短时间内在不正确信息之下工作。在这么短时间内的不可信状态信息对于管理员是个讨厌的事情,因为管理员可能会收到故障通知但它不久就不再有了。
对于Nagios用户而言,没有一个标准来检验缓存检测的时间深度或缓存击中率是可接受的。有些需要一个短暂的检测缓存时间深度设置和一个相对低的缓存击中率,而另一些则想要更长些的缓存时间和较高缓存击中率(当然会相对低的状态可信度),更有甚者希望完全不用缓存检测而只要100%可信度。测试不同的缓存检测时间窗口大小以及对状态信息可信度的影响将只是少数人想做的,他们只想得到在其自身环境下的“正确”取值。更多的信息见下面讨论。
如下的变量将决定用于缓存主机与服务检测结果的时间窗口值,在哪个范围内的检测结果可用于主机与服务的检测结果:
- cached_host_check_horizon变量控制缓存主机检测结果;
- cached_service_check_horizon变量控制缓存服务检测结果;
为了应用缓存检测机制达到最高效率,应该做如下工作:
- 编制规格化的主机检测计划;
- 使用MRTG来绘制统计状态图,做出(1)按需检测图(2)缓存检测图;
- 调整缓存检测的时间深度以适合当前情况。
在编制主机规格化检测计划时,可以把主机对象定义里的check_interval域指定一个大于0的值,如果这样做,还应保证将max_check_attempts域设置得大于1,否则会引起一个性能突降,这个性能突降在这篇文档里有说明。
给缓存检测的时间深度取值的一个较好方式是把有多少Nagios的按需检测被执行和有多少是取自于缓存检测结果这两个值做比较。nagiostats工具将提供缓存检测的相关信息,这些信息可以用MRTG绘制图表。样例的MRTG图表见下面,图中给出了缓存中取结果次数与实际执行检测的次数。

上述监控安装运行而产生图示的事先设置有:
- 共计有44台主机,它们全部用计划检测间隔来检测;
- 平均(规格化时间表内的)主机检测间隔是5分钟;
- cached_host_check_horizon值是15秒
第一张MRTG图表显示了有多少规格化计划主机检测与实际做了多少缓存主机检测的比较。在这例子中,每5分钟平均会有53次主机检测,其中有9次是按需主机检测(占到检测总数的17%);
第二张MRTG图表显示了沿时间轴上会有多少缓存主机检测结果产生。在这例子中,每5分钟平均会有2次缓存主机检测;
记住,缓存检测只是对按需检测起作用。基于图中的每5分钟的平均值,可见Nagios是每9次应做的按需检测中有2次是使用缓存检测结果。这看起来不多,但图中只是给出了一个小型的监控环境的结果,考虑到2比9就是22%的性能提高的话,就会明白将会在一个大型监控环境下将会显著地改善性能如果把主机检测的时间深度加大的话会提高缓存结果的击中率,但也会同时降低了缓存主机状态信息的可信度。
一旦有了几小时乃至几天的MRTG图表,就可以看出主机与服务的检测中有多少是插件执行而有多少是利用的缓存结果。利用这些图表信息来调整缓存检测的时间深度以适合当前环境,不断地利用MRTG图表来监视缓存检测时间深度变量对缓存检测统计在时间维度上的影响情况,并在需要的时候清掉重新来过。
状态“追踪”是个并不通用的功能特性。当使能了它,可以记录下 When enabled, it allows you to log changes in the output service and host checks even if the state of the host or service does not change. When stalking is enabled for a particular host or service, Nagios will watch that host or service very carefully and log any changes it sees in the output of check results. As you'll see, it can be very helpful to you in later analysis of the log files.
Under normal circumstances, the result of a host or service check is only logged if the host or service has changed state since it was last checked. There are a few exceptions to this, but for the most part, that's the rule.
If you enable stalking for one or more states of a particular host or service, Nagios will log the results of the host or service check if the output from the check differs from the output from the previous check. Take the following example of eight consecutive checks of a service:
表 9.1.
| Service Check #: | Service State: | Service Check Output: | Logged Normally | Logged With Stalking |
|---|---|---|---|---|
| x | OK | RAID array optimal |  | |
| x+1 | OK | RAID array optimal | | |
| x+2 | WARNING | RAID array degraded (1 drive bad, 1 hot spare rebuilding) |  | |
| x+3 | CRITICAL | RAID array degraded (2 drives bad, 1 host spare online, 1 hot spare rebuilding) | | |
| x+4 | CRITICAL | RAID array degraded (3 drives bad, 2 hot spares online) | | |
| x+5 | CRITICAL | RAID array failed | | |
| x+6 | CRITICAL | RAID array failed | | |
| x+7 | CRITICAL | RAID array failed | | |
Given this sequence of checks, you would normally only see two log entries for this catastrophe. The first one would occur at service check x+2 when the service changed from an OK state to a WARNING state. The second log entry would occur at service check x+3 when the service changed from a WARNING state to a CRITICAL state.
For whatever reason, you may like to have the complete history of this catastrophe in your log files. Perhaps to help explain to your manager how quickly the situation got out of control, perhaps just to laugh at it over a couple of drinks at the local pub...
Well, if you had enabled stalking of this service for CRITICAL states, you would have events at x+4 and x+5 logged in addition to the events at x+2 and x+3. Why is this? With state stalking enabled, Nagios would have examined the output from each service check to see if it differed from the output of the previous check. If the output differed and the state of the service didn't change between the two checks, the result of the newer service check would get logged.
A similiar example of stalking might be on a service that checks your web server. If the check_http plugin first returns a WARNING state because of a 404 error and on subsequent checks returns a WARNING state because of a particular pattern not being found, you might want to know that. If you didn't enable state stalking for WARNING states of the service, only the first WARNING state event (the 404 error) would be logged and you wouldn't have any idea (looking back in the archived logs) that future WARNING states were not due to a 404, but rather some text pattern that could not be found in the returned web page.
First, you must decide if you have a real need to analyze archived log data to find the exact cause of a problem. You may decide you need this feature for some hosts or services, but not for all. You may also find that you only have a need to enable stalking for some host or service states, rather than all of them. For example, you may decide to enable stalking for WARNING and CRITICAL states of a service, but not for OK and UNKNOWN states.
The decision to to enable state stalking for a particular host or service will also depend on the plugin that you use to check that host or service. If the plugin always returns the same text output for a particular state, there is no reason to enable stalking for that state.
You can enable state stalking for hosts and services by using the stalking_options directive in host and service definitions.
Volatile services are similar, but will cause notifications and event handlers to run. Stalking is purely for logging purposes.
You should be aware that there are some potential pitfalls with enabling stalking. These all relate to the reporting functions found in various CGIs (histogram, alert summary, etc.). Because state stalking will cause additional alert entries to be logged, the data produced by the reports will show evidence of inflated numbers of alerts.
As a general rule, I would suggest that you not enable stalking for hosts and services without thinking things through. Still, it's there if you need and want it.
Several people have asked how to go about monitoring clusters of hosts or services, so I decided to write up a little documentation on how to do this. Its fairly straightforward, so hopefully you find things easy to understand...
First off, we need to define what we mean by a "cluster". The simplest way to understand this is with an example. Let's say that your organization has five hosts which provide redundant DNS services to your organization. If one of them fails, its not a major catastrophe because the remaining servers will continue to provide name resolution services. If you're concerned with monitoring the availability of DNS service to your organization, you will want to monitor five DNS servers. This is what I consider to be a service cluster. The service cluster consists of five separate DNS services that you are monitoring. Although you do want to monitor each individual service, your main concern is with the overall status of the DNS service cluster, rather than the availability of any one particular service.
If your organization has a group of hosts that provide a high-availability (clustering) solution, I would consider those to be a host cluster. If one particular host fails, another will step in to take over all the duties of the failed server. As a side note, check out the High-Availability Linux Project for information on providing host and service redundancy with Linux.
There are several ways you could potentially monitor service or host clusters. I'll describe the method that I believe to be the easiest. Monitoring service or host clusters involves two things:
- Monitoring individual cluster elements
- Monitoring the cluster as a collective entity
Monitoring individual host or service cluster elements is easier than you think. In fact, you're probably already doing it. For service clusters, just make sure that you are monitoring each service element of the cluster. If you've got a cluster of five DNS servers, make sure you have five separate service definitions (probably using the check_dns plugin). For host clusters, make sure you have configured appropriate host definitions for each member of the cluster (you'll also have to define at least one service to be monitored for each of the hosts). Important: You're going to want to disable notifications for the individual cluster elements (host or service definitions). Even though no notifications will be sent about the individual elements, you'll still get a visual display of the individual host or service status in the status CGI. This will be useful for pinpointing the source of problems within the cluster in the future.
Monitoring the overall cluster can be done by using the previously cached results of cluster elements. Although you could re-check all elements of the cluster to determine the cluster's status, why waste bandwidth and resources when you already have the results cached? Where are the results cached? Cached results for cluster elements can be found in the status file (assuming you are monitoring each element). The check_cluster plugin is designed specifically for checking cached host and service states in the status file. Important: Although you didn't enable notifications for individual elements of the cluster, you will want them enabled for the overall cluster status check.
The check_cluster plugin is designed to report the overall status of a host or service cluster by checking the status information of each individual host or service cluster elements.
More to come... The check_cluster plugin can be found in the contrib directory of the Nagios Plugins release at http://sourceforge.net/projects/nagiosplug/.
Let's say you have three DNS servers that provide redundant services on your network. First off, you need to be monitoring each of these DNS servers seperately before you can monitor them as a cluster. I'll assume that you already have three seperate services (all called "DNS Service") associated with your DNS hosts (called "host1", "host2" and "host3").
In order to monitor the services as a cluster, you'll need to create a new "cluster" service. However, before you do that, make sure you have a service cluster check command configured. Let's assume that you have a command called check_service_cluster defined as follows:
define command{
		command_name	check_service_cluster
		command_line	/usr/local/nagios/libexec/check_cluster --service -l $ARG1$ -w $ARG2$ -c $ARG3$ -d $ARG4$
		}
Now you'll need to create the "cluster" service and use the check_service_cluster command you just created as the cluster's check command. The example below gives an example of how to do this. The example below will generate a CRITICAL alert if 2 or more services in the cluster are in a non-OK state, and a WARNING alert if only 1 of the services is in a non-OK state. If all the individual service members of the cluster are OK, the cluster check will return an OK state as well.
define service{
		...
		check_command	check_service_cluster!"DNS Cluster"!1!2!$SERVICESTATEID:host1:DNS Service$,$SERVICESTATEID:host2:DNS Service$,$SERVICESTATEID:host3:DNS Service$
		...
		}
It is important to notice that we are passing a comma-delimited list of on-demand service state macros to the $ARG4$ macro in the cluster check command. That's important! Nagios will fill those on-demand macros in with the current service state IDs (numerical values, rather than text strings) of the individual members of the cluster.
Monitoring host clusters is very similiar to monitoring service clusters. Obviously, the main difference is that the cluster members are hosts and not services. In order to monitor the status of a host cluster, you must define a service that uses the check_cluster plugin. The service should not be associated with any of the hosts in the cluster, as this will cause problems with notifications for the cluster if that host goes down. A good idea might be to associate the service with the host that Nagios is running on. After all, if the host that Nagios is running on goes down, then Nagios isn't running anymore, so there isn't anything you can do as far as monitoring (unless you've setup redundant monitoring hosts)...
Anyway, let's assume that you have a check_host_cluster command defined as follows:
define command{
		command_name	check_host_cluster
		command_line	/usr/local/nagios/libexec/check_cluster --host -l $ARG1$ -w $ARG2$ -c $ARG3$ -d $ARG4$
		}
Let's say you have three hosts (named "host1", "host2" and "host3") in the host cluster. If you want Nagios to generate a warning alert if one host in the cluster is not UP or a critical alert if two or more hosts are not UP, the the service you define to monitor the host cluster might look something like this:
define service{
		...
		check_command	check_host_cluster!"Super Host Cluster"!1!2!$HOSTSTATEID:host1$,$HOSTSTATEID:host2$,$HOSTSTATEID:host3$
		...
		}
It is important to notice that we are passing a comma-delimited list of on-demand host state macros to the $ARG4$ macro in the cluster check command. That's important! Nagios will fill those on-demand macros in with the current host state IDs (numerical values, rather than text strings) of the individual members of the cluster.
That's it! Nagios will periodically check the status of the host cluster and send notifications to you when its status is degraded (assuming you've enabled notification for the service). Note that for thehost definitions of each cluster member, you will most likely want to disable notifications when the host goes down . Remeber that you don't care as much about the status of any individual host as you do the overall status of the cluster. Depending on your network layout and what you're trying to accomplish, you may wish to leave notifications for unreachable states enabled for the host definitions.
在运行时,如下服务检测属性是可以修改的:
- 检测命令和命令行参数
- 检测周期
- 最大检测尝试次数
- 检测周期
- 事件处理命令及命令参数
在运行时,如下主机检测属性是可以修改的:
- 检测命令和命令行参数
- 检测周期
- 最大检测尝试次数
- 检测周期
- 事件处理命令及命令参数
在运行时,如下的全局属性可以修改:
- 全局的主机事件处理命令及命令参数
- 全局的服务事件处理命令及命令参数
为了在运行时改变全局的、主机的或服务的属性,你需要给出恰当的外部命令给Nagios,在外部命令文件中设置。表格列出的不同属性可以完成对各自不同的属性进行修改。
一个给适应性检测而制作的完整外部命令列表(包括如何使用样例)可以在如下URL中找到:http://www.nagios.org/developerinfo/externalcommands/
注意
注意以下内容:
- 当修改检测命令、检测周期或事件处理句柄时,很重要的一点是在Nagios启动之前要注意给这些新值定义好。如果在Nagios启动之后,任何试图修改这些设置的尝试都会被忽略。
- 你可以给指定特定的命令参数给这些命令名-只是使用分隔符(!)分开几个命令参数。更多的有关如何定义命令参数的信息可以在宏及应用的文档中找到。
当Nagios处于被动地从远程源接收主机检测结果时(如其他的Nagios分布式实例或分散式安装),由远程资源上报告的主机的状态可能并不能正确地显示在Nagios的视图上。在处于分布式或分散式安装方式下由多个Nagios实例结果中保证正确地显示主机状态是非常重要的。
下图给出分散式安装的简单例子。图中
- Nagios-A是主监控服务器并可以对全局的路由器和交换机进行监控。
- Nagios-B和Nagios-C是后备的监控服务器,可以从Nagios-A接收被动检测结果。
- 当Router-C和Router-D处于故障并离线状态。
那么Router-C和Router-D当前应处于什么状态?结果取决于你访问哪个Nagios实例。
- Nagios-A报告Router-D处于宕机且Router-C处于不可达
- Nagios-B报告Router-C处于宕机且Router-D处于不可达
- Nagios-C报告全部的路由器处于宕机
每个Nagios实例都有不同的网络状态视图,由于后备的监控服务不可以盲目地从主监控主服务器接收主机状态否则它们会得不到正确的网络状态信息。
由于没有转换主监控服务器(Nagios-A)的被动主机检测结果,Nagios-C将认为Router-D处于不可达,除非它自已得到其真的宕机。相同地,宕机或不可达状态(从Nagios-A)看过去的Router-C和Router-D的视图会使得Nagios-B的视图翻转。
注意
有时你不想让Nagios因为远程的源给出的状态而使得视图中显示宕机或不可达状态而翻转你处于“正确”状态的视图,如分布式环境下,你想让中心监控服务器得到不同的分布节点下的不同网络部分的视图。
默认情况下,Nagios将不会自动地用被动检测的宕机和不可达状态来迁移状态。如果你需要必须使能它。
自动地将被动检测结果进行状态迁移受translate_passive_host_checks变量的控制。使能它将使本地的Nagios实例接收来自远程资源的宕机和不可达状态迁移而改变显示状态。

This is intended to be a brief overview of some things you should keep in mind when installing Nagios, so as set it up in a secure manner.
Your monitoring box should be viewed as a backdoor into your other systems. In many cases, the Nagios server might be allowed access through firewalls in order to monitor remote servers. In most all cases, it is allowed to query those remote servers for various information. Monitoring servers are always given a certain level of trust in order to query remote systems. This presents a potential attacker with an attractive backdoor to your systems. An attacker might have an easier time getting into your other systems if they compromise the monitoring server first. This is particularly true if you are making use of shared SSH keys in order to monitor remote systems.
If an intruder has the ability to submit check results or external commands to the Nagios daemon, they have the potential to submit bogus monitoring data, drive you nuts you with bogus notifications, or cause event handler scripts to be triggered. If you have event handler scripts that restart services, cycle power, etc. this could be particularly problematic.
Another area of concern is the ability for intruders to sniff monitoring data (status information) as it comes across the wire. If communication channels are not encrypted, attackers can gain valuable information by watching your monitoring information. Take as an example the following situation: An attacker captures monitoring data on the wire over a period of time and analyzes the typical CPU and disk load usage of your systems, along with the number of users that are typically logged into them. The attacker is then able to determine the best time to compromise a system and use its resources (CPU, etc.) without being noticed.
Here are some tips to help ensure that you keep your systems secure when implementing a Nagios-based monitoring solution...
- Use a Dedicated Monitoring Box. I would recommend that you install Nagios on a server that is dedicated to monitoring (and possibly other admin tasks). Protect your monitoring server as if it were one of the most important servers on your network. Keep running services to a minimum and lock down access to it via TCP wrappers, firewalls, etc. Since the Nagios server is allowed to talk to your servers and may be able to poke through your firewalls, allowing users access to your monitoring server can be a security risk. Remember, its always easier to gain root access through a system security hole if you have a local account on a box.
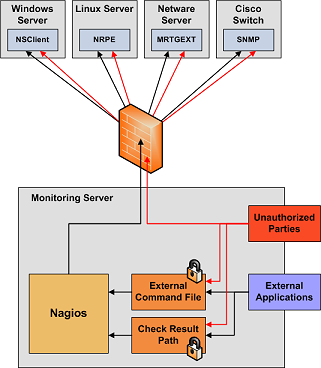
- Don't Run Nagios As Root. Nagios doesn't need to run as root, so don't do it. You can tell Nagios to drop privileges after startup and run as another user/group by using the nagios_user and nagios_group directives in the main config file. If you need to execute event handlers or plugins which require root access, you might want to try using sudo.
- Lock Down The Check Result Directory. Make sure that only the nagios user is able to read/write in the check result path. If users other than nagios (or root) are able to write to this directory, they could send fake host/service check results to the Nagios daemon. This could result in annoyances (bogus notifications) or security problems (event handlers being kicked off).
- Lock Down The External Command File. If you enable external commands, make sure you set proper permissions on the /usr/local/nagios/var/rw directory. You only want the Nagios user (usually nagios) and the web server user (usually nobody, httpd, apache2, or www-data) to have permissions to write to the command file. If you've installed Nagios on a machine that is dedicated to monitoring and admin tasks and is not used for public accounts, that should be fine. If you've installed it on a public or multi-user machine (not recommended), allowing the web server user to have write access to the command file can be a security problem. After all, you don't want just any user on your system controlling Nagios through the external command file. In this case, I would suggest only granting write access on the command file to the nagios user and using something like CGIWrap to run the CGIs as the nagios user instead of nobody.
- Require Authentication In The CGIs. I would strongly suggest requiring authentication for accessing the CGIs. Once you do that, read the documentation on the default rights that authenticated contacts have, and only authorize specific contacts for additional rights as necessary. Instructions on setting up authentication and configuring authorization rights can be found here. If you disable the CGI authentication features using the use_authentication directive in the CGI config file, the command CGI will refuse to write any commands to the external command file. After all, you don't want the world to be able to control Nagios do you?
- Use Full Paths In Command Definitions. When you define commands, make sure you specify the full path (not a relative one) to any scripts or binaries you're executing.
- Hide Sensitive Information With $USERn$ Macros. The CGIs read the main config file and object config file(s), so you don't want to keep any sensitive information (usernames, passwords, etc) in there. If you need to specify a username and/or password in a command definition use a $USERn$ macro to hide it. $USERn$ macros are defined in one or more resource files. The CGIs will not attempt to read the contents of resource files, so you can set more restrictive permissions (600 or 660) on them. See the sample resource.cfg file in the base of the Nagios distribution for an example of how to define $USERn$ macros.
- Strip Dangerous Characters From Macros. Use the illegal_macro_output_chars directive to strip dangerous characters from the $HOSTOUTPUT$, $SERVICEOUTPUT$, $HOSTPERFDATA$, and $SERVICEPERFDATA$ macros before they're used in notifications, etc. Dangerous characters can be anything that might be interpreted by the shell, thereby opening a security hole. An example of this is the presence of backtick (`) characters in the $HOSTOUTPUT$, $SERVICEOUTPUT$, $HOSTPERFDATA$, and/or $SERVICEPERFDATA$ macros, which could allow an attacker to execute an arbitrary command as the nagios user (one good reason not to run Nagios as the root user).
- Secure Access to Remote Agents. Make sure you lock down access to agents (NRPE, NSClient, SNMP, etc.) on remote systems using firewalls, access lists, etc. You don't want everyone to be able to query your systems for status information. This information could be used by an attacker to execute remote event handler scripts or to determine the best times to go unnoticed.

- Secure Communication Channels. Make sure you encrypt communication channels between different Nagios installations and between your Nagios servers and your monitoring agents whenever possible. You don't want someone to be able to sniff status information going across your network. This information could be used by an attacker to determine the best times to go unnoticed.
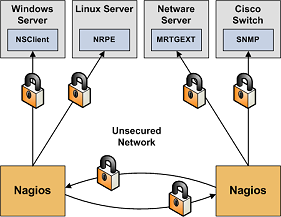

So you've finally got Nagios up and running and you want to know how you can tweak it a bit. Tuning Nagios to increase performance can be necessary when you start monitoring a large number (> 1,000) of hosts and services. Here are a few things to look at for optimizing Nagios...
- Graph performance statistics with MRTG. In order to keep track of how well your Nagios installation handles load over time and how your configuration changes affect it, you should be graphing several important statistics with MRTG. This is really, really, really useful when it comes to tuning the performance of a Nagios installation. Really. Information on how to do this can be found here.
- Use large installation tweaks. Enabling the use_large_installation_tweaks option may provide you with better performance. Read more about what this option does here.
- Disable environment macros. Macros are normally made available to check, notification, event handler, etc. commands as environment variables. This can be a problem in a large Nagios installation, as it consumes some additional memory and (more importantly) more CPU. If your scripts don't need to access the macros as environment variables (e.g. you pass all necessary macros on the command line), you don't need this feature. You can prevent macros from being made available as environment variables by using the enable_environment_macros option.
- Check Result Reaper Frequency. The check_result_reaper_frequency variable determines how often Nagios should check for host and service check results that need to be processed. The maximum amount of time it can spend processing those results is determined by the max reaper time (see below). If your reaper frequency is too high (too infrequent), you might see high latencies for host and service checks.
- Max Reaper Time. The max_check_result_reaper_time variables determines the maximum amount of time the Nagios daemon can spend processing the results of host and service checks before moving on to other things - like executing new host and service checks. Too high of a value can result in large latencies for your host and service checks. Too low of a value can have the same effect. If you're experiencing high latencies, adjust this variable and see what effect it has. Again, you should be graphing statistics in order to make this determination.
- Adjust buffer slots. You may need to adjust the value of the external_command_buffer_slots option. Graphing buffer slot statistics with MRTG (see above) is critical in determining what values you should use for this option.
- Check service latencies to determine best value for maximum concurrent checks. Nagios can restrict the number of maximum concurrently executing service checks to the value you specify with the max_concurrent_checks option. This is good because it gives you some control over how much load Nagios will impose on your monitoring host, but it can also slow things down. If you are seeing high latency values (> 10 or 15 seconds) for the majority of your service checks (via the extinfo CGI), you are probably starving Nagios of the checks it needs. That's not Nagios's fault - its yours. Under ideal conditions, all service checks would have a latency of 0, meaning they were executed at the exact time that they were scheduled to be executed. However, it is normal for some checks to have small latency values. I would recommend taking the minimum number of maximum concurrent checks reported when running Nagios with the -s command line argument and doubling it. Keep increasing it until the average check latency for your services is fairly low. More information on service check scheduling can be found here.
- Use passive checks when possible. The overhead needed to process the results of passive service checks is much lower than that of "normal" active checks, so make use of that piece of info if you're monitoring a slew of services. It should be noted that passive service checks are only really useful if you have some external application doing some type of monitoring or reporting, so if you're having Nagios do all the work, this won't help things.
- Avoid using interpreted plugins. One thing that will significantly reduce the load on your monitoring host is the use of compiled (C/C++, etc.) plugins rather than interpreted script (Perl, etc) plugins. While Perl scripts and such are easy to write and work well, the fact that they are compiled/interpreted at every execution instance can significantly increase the load on your monitoring host if you have a lot of service checks. If you want to use Perl plugins, consider compiling them into true executables using perlcc(1) (a utility which is part of the standard Perl distribution) or compiling Nagios with an embedded Perl interpreter (see below).
- Use the embedded Perl interpreter. If you're using a lot of Perl scripts for service checks, etc., you will probably find that compiling the embedded Perl interpreter into the Nagios binary will speed things up.
- Optimize host check commands. If you're checking host states using the check_ping plugin you'll find that host checks will be performed much faster if you break up the checks. Instead of specifying a max_attempts value of 1 in the host definition and having the check_ping plugin send 10 ICMP packets to the host, it would be much faster to set the max_attempts value to 10 and only send out 1 ICMP packet each time. This is due to the fact that Nagios can often determine the status of a host after executing the plugin once, so you want to make the first check as fast as possible. This method does have its pitfalls in some situations (i.e. hosts that are slow to respond may be assumed to be down), but I you'll see faster host checks if you use it. Another option would be to use a faster plugin (i.e. check_fping) as the host_check_command instead of check_ping.
- Schedule regular host checks. Scheduling regular checks of hosts can actually help performance in Nagios. This is due to the way the cached check logic works (see below). Prior to Nagios 3, regularly scheduled host checks used to result in a big performance hit. This is no longer the case, as host checks are run in parallel - just like service checks. To schedule regular checks of a host, set the check_interval directive in the host definition to something greater than 0.
- Enable cached host checks. Beginning in Nagios 3, on-demand host checks can benefit from caching. On-demand host checks are performed whenever Nagios detects a service state change. These on-demand checks are executed because Nagios wants to know if the host associated with the service changed state. By enabling cached host checks, you can optimize performance. In some cases, Nagios may be able to used the old/cached state of the host, rather than actually executing a host check command. This can speed things up and reduce load on monitoring server. In order for cached checks to be effective, you need to schedule regular checks of your hosts (see above). More information on cached checks can be found here.
- Don't use agressive host checking. Unless you're having problems with Nagios recognizing host recoveries, I would recommend not enabling the use_aggressive_host_checking option. With this option turned off host checks will execute much faster, resulting in speedier processing of service check results. However, host recoveries can be missed under certain circumstances when this it turned off. For example, if a host recovers and all of the services associated with that host stay in non-OK states (and don't "wobble" between different non-OK states), Nagios may miss the fact that the host has recovered. A few people may need to enable this option, but the majority don't and I would recommendnot using it unless you find it necessary...
- External command optimizations. If you're processing a lot of external commands (i.e. passive checks in a distributed setup, you'll probably want to set the command_check_interval variable to -1. This will cause Nagios to check for external commands as often as possible. You should also consider increasing the number of available external command buffer slots. Buffers slots are used to hold external commands that have been read from the external command file (by a separate thread) before they are processed by the Nagios daemon. If your Nagios daemon is receiving a lot of passive checks or external commands, you could end up in a situation where the buffers are always full. This results in child processes (external scripts, NSCA daemon, etc.) blocking when they attempt to write to the external command file. I would highly recommend that you graph external command buffer slot usage using MRTG and the nagiostats utility as described here, so you understand the typical external command buffer usage of your Nagios installation.
- Optimize hardware for maximum performance. NOTE: Hardware performance shouldn't be an issue unless: 1) you're monitoring thousands of services, 2) you're doing a lot of post-processing of performance data, etc. Your system configuration and your hardware setup are going to directly affect how your operating system performs, so they'll affect how Nagios performs. The most common hardware optimization you can make is with your hard drives. CPU and memory speed are obviously factors that affect performance, but disk access is going to be your biggest bottlenck. Don't store plugins, the status log, etc on slow drives (i.e. old IDE drives or NFS mounts). If you've got them, use UltraSCSI drives or fast IDE drives. An important note for IDE/Linux users is that many Linux installations do not attempt to optimize disk access. If you don't change the disk access parameters (by using a utility like hdparam), you'll loose out on a lot of the speedy features of the new IDE drives.
在Nagios发行包中含有一个名为nagiostats的工具,它与Nagios主程序一起被编译和安装。Nagios状态工具可以在线地收集各种Nagios的运行信息并将在性能调优中非常有用。可以把信息搞成要么是可阅读的要么MRTG兼容型的格式。
为获取人可阅读的在线运行Nagios性能数据的信息,使用命令行-c参数来运行nagiostats工具并指定主配置文件位置,象这样:
[nagios@lanman ~]# /usr/local/nagios/bin/nagiostats -c /usr/local/nagios/etc/nagios.cfg


	Nagios Stats 3.0prealpha-05202006
	Copyright (c) 2003-2007 Ethan Galstad (www.nagios.org)
	Last Modified: 05-20-2006
	License: GPL

	CURRENT STATUS DATA
	------------------------------------------------------
	Status File:                            /usr/local/nagios/var/status.dat
	Status File Age:                        0d 0h 0m 9s
	Status File Version:                    3.0prealpha-05202006

	Program Running Time:                   0d 5h 20m 39s
	Nagios PID:                             10119
	Used/High/Total Command Buffers:        0 / 0 / 64
	Used/High/Total Check Result Buffers:   0 / 7 / 512

	Total Services:                         95
	Services Checked:                       94
	Services Scheduled:                     91
	Services Actively Checked:              94
	Services Passively Checked:             1
	Total Service State Change:             0.000 / 78.950 / 1.026 %
	Active Service Latency:                 0.000 / 4.272 / 0.561 sec
	Active Service Execution Time:          0.000 / 60.007 / 2.066 sec
	Active Service State Change:            0.000 / 78.950 / 1.037 %
	Active Services Last 1/5/15/60 min:     4 / 68 / 91 / 91
	Passive Service State Change:           0.000 / 0.000 / 0.000 %
	Passive Services Last 1/5/15/60 min:    0 / 0 / 0 / 0
	Services Ok/Warn/Unk/Crit:              58 / 16 / 0 / 21
	Services Flapping:                      1
	Services In Downtime:                   0

	Total Hosts:                            24
	Hosts Checked:                          24
	Hosts Scheduled:                        24
	Hosts Actively Checked:                 24
	Host Passively Checked:                 0
	Total Host State Change:                0.000 / 9.210 / 0.384 %
	Active Host Latency:                    0.000 / 0.446 / 0.219 sec
	Active Host Execution Time:             1.019 / 10.034 / 2.764 sec
	Active Host State Change:               0.000 / 9.210 / 0.384 %
	Active Hosts Last 1/5/15/60 min:        5 / 22 / 24 / 24
	Passive Host State Change:              0.000 / 0.000 / 0.000 %
	Passive Hosts Last 1/5/15/60 min:       0 / 0 / 0 / 0
	Hosts Up/Down/Unreach:                  18 / 4 / 2
	Hosts Flapping:                         0
	Hosts In Downtime:                      0

	Active Host Checks Last 1/5/15 min:     9 / 52 / 164
	Scheduled:                           4 / 23 / 75
	On-demand:                           3 / 23 / 69
	Cached:                              2 / 6 / 20
	Passive Host Checks Last 1/5/15 min:    0 / 0 / 0
	Active Service Checks Last 1/5/15 min:  9 / 80 / 244
	Scheduled:                           9 / 80 / 244
	On-demand:                           0 / 0 / 0
	Cached:                              0 / 0 / 0
	Passive Service Checks Last 1/5/15 min: 0 / 0 / 0

	External Commands Last 1/5/15 min:      0 / 0 / 0

[nagios@lanman ~]#
如你所见,它显示了Nagios进程在不同统计频度上的一系列数字,有多个值在统计频度上显示,主要是(除非特别指定)最小值、最大值和平均值。
可以将nagiostats工具与MRTG或其他兼容程序集成来显示Nagios的统计结果。为完成它,用--mrtg和--data参数来运行nagiostats工具。参数--data可指定哪个哪种统计值被绘制成图,可用的值可以通过用--help命令参数运行nagiostats来查找。
注意:有关使用nagiostats来对Nagios统计状态结果绘制MRTG图表信息可以查阅这篇文档。
Nagios状态应用工具可以利用MRTG绘制多种Nagios性能统计图表。这个很重要,因为它可以:
- 确保Nagios被更有效率地操作;
- 定位监控过程中的问题;
- 感知因Nagios配置修改而导致的性能冲突影响;
绘制各种Nagios的性能统计图的MRTG配置文件片段可查看Nagios发行包里sample-config/子目录下的mrtg.cfg文件。如果需要可以创建性能信息的其他图表文件 - 样例只是提供了一个好的起点。
一旦你复制这些样例文件到你的MRTG配置文件(/etc/mrtg/mrtg.cfg)里,你将在MRTG的下次运行时得到这些新图表。
下面将描述一下几个样例MRTG图表的内容及用途...
表 10.1.
自主主机检测-该图显示了沿时间轴做过多少次自主主机检测(包括规格化计划检测和按需检测),有助于理解: |  |
自主服务检测-该图显示了沿时间轴做过多少次自主服务检测(包括规格化计划检测和按需检测),有助于理解: |  |
主机和服务检测缓存检测-该图显示了沿时间轴做过多少次主机与服务缓存检测。有助于理解: | 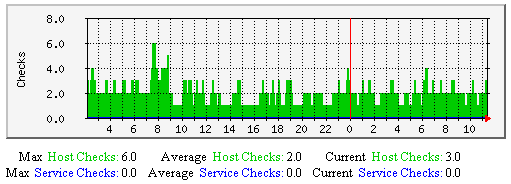 |
强制主机和服务检测-该图显示了沿时间轴做过多少次强制主机与服务检测。有助于理解: | 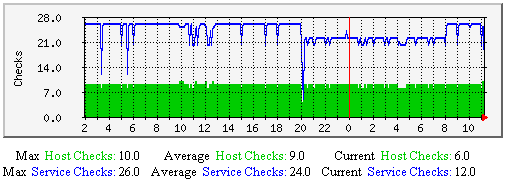 |
主机和服务自主检测-该图显示了沿时间轴上持续地有多少个主机与服务(总数量)自主检测。有助于理解: | 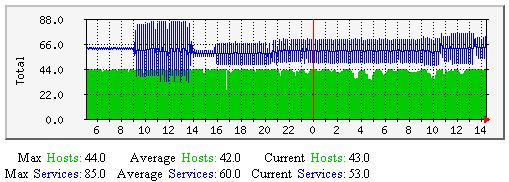 |
主机和服务强制检测-该图显示了沿时间轴上持续地有多少个主机与服务(总数量)强制检测。有助于理解: | 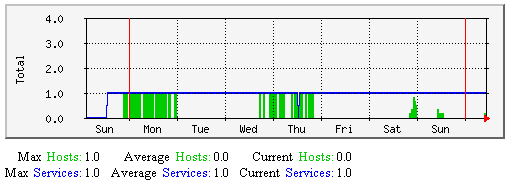 |
服务检测传输时延与执行的平均时间-该图显示了沿时间轴上有关服务检测的传输时延和执行时间的平均值。有助于理解: 若是有居高不下的传输时延可能是由于下列参数需要调整: | 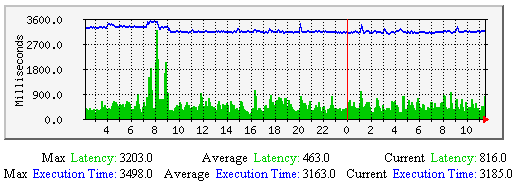 |
服务状态改变的平均值-该图显示了沿时间轴服务状态改变的百分比(变化率的度量),不论是在自主还是强制方式,最后一次检测显示服务中止的情况。有助于理解: | 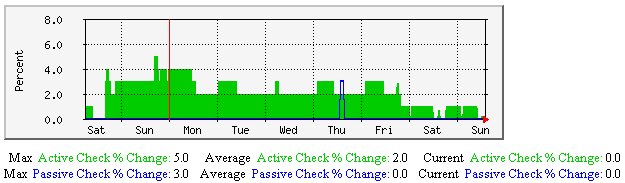 |
主机检测的传输时延与执行的平均时间-该图显示了沿时间轴上主机检测传输时延和执行时间的平均值。有助于理解: 若有居高不下的传输时延可能需要调整下列参数: | 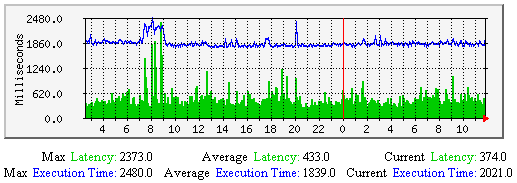 |
平均主机状态改变-该图显示了沿时间轴主机状态发生变化的百分比(变化率的度量),不论是自主还是强制检测方式,最后一次主机检测的中止情况。有助于理解: | 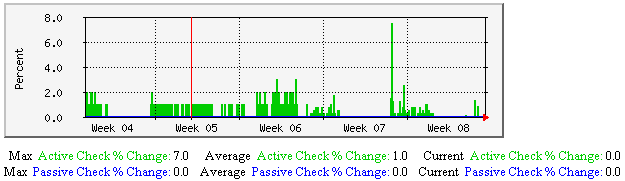 |
外部命令-该图显示了Nagio主守护进程沿时间轴有多少个外部命令要处理。除非要处理大量的外部命令(如在分布式安装环境下),该图基本上是空白的。监视外部命令将有助于如下内容的影响理解: |  |
外部命令缓冲-该图显示了沿时间轴多少外部命令使用缓冲。如果使用中的缓冲数量接近了可用缓冲数量,说明需要增加可用的外部命令缓冲块。每个缓冲块可存放一个外部命令。缓冲被用于临时存入外部文件,临时期开始于外部命令自外部命令文件中取出时刻,结束于Nagios守护程序处理完成外部命令结果。 | 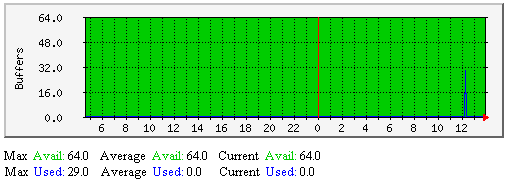 |
在此之前,很重要的一点是要理解联系人授权与认证的含义及两者的不同之处,主要有:
- 一个认证用户是指有权以指定的用户名和口令通过WEB服务器认证可以获取Nagios的WEB接口页面的用户;
- 一个认证的联系是是在联系人定义文件里的短用户名中列出的用户名;
假定你已经按快速指南里的方式配置好Web服务器,在调用Nagios的CGI程序模块前要认证。而且已经有了一个用户帐号(nagiosadmin)或对CGI模块操作。
想定义更多的联系人来接收主机和服务的通知,一般是想让联系人通过Nagios的Web接口来做。可以按下面命令来给CGI程序指定额外的用户,把下面<username>用真实的想加入的用户名来替换。一般情况下,这个名字应是与配置文件中的联系人对象定义中的短名称相匹配。
htpasswd /usr/local/nagios/etc/htpasswd.users <username>
下一步是配置CGI模块使用认证与授权功能来决定什么样的信息或是命令可以操作。把CGI配置文件里面的use_authentication选项置为非零值,如:
use_authentication=1
好了,设置好CGI模块的认证与授权了。
当使能了认证与授权功能后,CGI模块将给用户什么默认许可呢?
表 10.2. 默认许可权限
| CGI模块的数据 | 认证的联系人* | 其他认证的用户(非设定的对象联系人)* |
|---|---|---|
| Host Status Information | Yes | No |
| Host Configuration Information | Yes | No |
| Host History | Yes | No |
| Host Notifications | Yes | No |
| Host Commands | Yes | No |
| Service Status Information | Yes | No |
| Service Configuration Information | Yes | No |
| Service History | Yes | No |
| Service Notifications | Yes | No |
| Service Commands | Yes | No |
| All Configuration Information | No | No |
| System/Process Information | No | No |
| System/Process Commands | No | No |
认证的联系人*可以取得每个以他为联系人的每个服务(联系人不是他的服务不行)...
- Authorization to view service status information
- Authorization to view service configuration information
- Authorization to view history and notifications for the service
- Authorization to issue service commands
认证的联系人*可以对每个以他为联系人的每个主机(联系人不是他的主机不行)...
- Authorization to view host status information
- Authorization to view host configuration information
- Authorization to view history and notifications for the host
- Authorization to issue host commands
- Authorization to view status information for all services on the host
- Authorization to view configuration information for all services on the host
- Authorization to view history and notification information for all services on the host
- Authorization to issue commands for all services on the host
重要一点是默认情况下以下内容无人被授权得到如下内容...
- Viewing the raw log file via the showlog CGI
- Viewing Nagios process information via the extended information CGI
- Issuing Nagios process commands via the command CGI
- Viewing host group, contact, contact group, time period, and command definitions via the configuration CGI
毫无疑问需要这些信息,所以要看下面的内容以使你(可能包括其他人)有权限得到这些额外的信息...
可以允许让认证的联系人或其他认证的用户有权限得到CGI模块里的额外信息,通过在CGI配置文件里增加一些授权变量来实现。我实现了如下的授权变量以使他们可以控制无授权的情况下不能取得信息,总归比没有这些要好吧...
在CGI配置文件里加了如下的变量控制额外的授权内容...
如果被各种各样的CGI模块里所需要的授权搞糊涂了,可以看一下每个CGI模块介绍里所写的授权要求的说明,在这个文档里面。
如果WEB服务器是建在一个加密域(象在防火墙后面)或是用SSL加密通讯的,可以设置一个默认用户来完成CGI操作。可以在CGI配置文件里设置default_user_name选项。通过设置一个默认的用户来操作CGI模块,可以不必再由WEB服务器来做验证。这样通过因特网,可以省去基本的WEB认证过程,或以空白的口令进行基本认证(基本数据已经加过密了)。
Important:不要使用默认的用户名这个功能,除非运行在个加密的Web服务或加密域里,每个人都经过了充分认证后才会操作CGI模块,因为此时没有经过Web认证的每一个用户都具备相同的、全部的设置操作权限!
如果你安装了Nagios的客户端,你可能需要定制自已的CGI模块的页面头和尾以显示自己的信息。这对于向最终用户提供联系人信息等内容时比较有用。
很重要一点是,除非它们会被执行,否则用户自定制的页面头和尾的内容在显示之前不会被预先处理。页面的头和尾内容包含文件只是被简单地读入并显示到CGI页面上,这意味着头和尾的定义中只能包含一些特定的可被浏览器支持的内容(如HTML、JavaScript等)。
如果用户定制的头和尾文件是可执行的,它们会在CGI模块被调用时显示到最终用户的浏览器,因而它们必须是合法的HTML结果。利用这一点可以执行你定制的CGI程序来插入到Nagios的显示数据之中,这已被用于从RRDTOOL中获取的图表(用ddraw命令)或是在Nagios的显示板上显示命令菜单。可执行的用户定制的CGI页面的头和尾与Nagios的CGI程序使用相同的CGI环境,因而你的CGI程序可以同样地解析URL调用行信息、用户验证信息等以制作出你的输出内容。
你可以把CGIs程序模块所包含的用户定制头尾内容,经常是HTML文件放在Nagios的HTML的ssi/子目录中,一般是在这个位置/usr/local/nagios/share/ssi上。
用户定制头通常是紧跟在CGI的<BODY>标记之后而尾经常是跟在</BODY>标记之前。
有两种类型的用户定制的头和尾:
- 全局的头和尾定义。文件必须分别被命名为common-header.ssi和common-footer.ssi。如果它们被定义,它们将被全部的CGI程序模块所调用显示。
- 特定的CGI模块的用户定制的头和尾。文件必须被命名为如下格式CGINAME-header.ssi和CGINAME-footer.ssi,这里的CGINAME是那个CGI程序模块不带有.cgi后缀的部分。比如给报警汇总CGI模块即(summary.cgi)的头和尾必须分别被命名为summary-header.ssi和summary-footer.ssi。
如果你并不需要用户定制的头和尾,你可以只用全局的头定义或是全局的尾定义,真的要看你所需了。

Nagios可以非常容易地与现有框架集成,这也就是为何Nagios被广泛地应用的一原因。有不少方式来与现有管理软件进行集成,你使用管理软件来监控你所拥有的各种各样的新型或用户定制的硬件、服务或是应用程序。
为了监控新硬件、服务或是应用程序,审视如下的文档:
为使Nagios取得外部应用程序的数据,审视如下的文档:
将状态、性能或是告警信息报送给外部应用,审视如下文档:
注意
SNMP的无所不管除了恶长以外一无是处。接收SNMP消息并将它放到Nagio里(象强制检测结果一样)是件很繁闷的事。为使之更简单,建议你取出Alex Burger的SNMP Trap Translator项目,它位于http://www.snmptt.org,这里面在Nagios里集成了Net-SNMP、SNMPTT及增强型的消息陷井处理系统。
好了,就这么多。

This document explains how to easily generate alerts in Nagios for connection attempts that are rejected by TCP wrappers. For example, if an unauthorized host attempts to connect to your SSH server, you can receive an alert in Nagios that contains the name of the host that was rejected. If you implement this on your Linux/Unix boxes, you'll be surprised how many port scans you can detect across your network.
These directions assume:
- You are already familiar with passive checks and how they work.
- You are already familiar with volatile services and how they work.
- The host which you are generating alerts for (i.e. the host you are using TCP wrappers on) is a remote host (called firestorm in this example). If you want to generate alerts on the same host that Nagios is running you will need to make a few modifications to the examples I provide.
- You have installed the NSCA daemon on your monitoring server and the NSCA client (send_nsca) on the remote machine that you are generating TCP wrapper alerts from.
If you haven't done so already, create a host definition for the remote host (firestorm).
Next, define a service in one of your object configuration files for the TCP wrapper alerts on host firestorm. The service definition might look something like this:
例 11.1.
define service{
host_name firestorm
service_description TCP Wrappers
is_volatile 1
active_checks_enabled 0
passive_checks_enabled 1
max_check_attempts 1
check_command check_none
...
}
There are some important things to note about the above service definition:
- The volatile option enabled. We want this option enabled because we want a notification to be generated for every alert that comes in.
- Active checks of the service as disabled, while passive checks are enabled. This means that the service will never be actively checked by Nagios - all alert information will have to be received passively from an external source.
- The max_check_attempts value is set to 1. This guarantees you will get a notification when the first alert is generated.
Now you're going to have to modify the /etc/hosts.deny file on firestorm. In order to have the TCP wrappers send an alert to the monitoring host whenever a connection attempt is denied, you'll have to add a line similiar to the following:
例 11.2.
This line assumes that there is a script called handle_tcp_wrapper in the /usr/local/nagios/libexec/eventhandlers/ directory on firestorm. We'll write that script next.
The last thing you need to do is write the handle_tcp_wrapper script on firestorm that will send the alert back to the Nagios server. It might look something like this:
例 11.3.
#!/bin/sh
/usr/local/nagios/libexec/eventhandlers/submit_check_result firestorm "TCP Wrappers" 2 "Denied $2-$1" > /dev/null 2> /dev/null
Notice that the handle_tcp_wrapper script calls the submit_check_result script to actually send the alert back to the monitoring host. Assuming your Nagios server is called monitor, the submit check_result script might look like this:
例 11.4.
#!/bin/sh
# Arguments
# $1 = name of host in service definition
# $2 = name/description of service in service definition
# $3 = return code
# $4 = output
/bin/echo -e "$1\t$2\t$3\t$4\n" | /usr/local/nagios/bin/send_nsca monitor -c /usr/local/nagios/etc/send_nsca.cfg
You've now configured everything you need to, so all you have to do is restart the inetd process on firestorm and restart Nagios on your monitoring server. That's it! When the TCP wrappers on firestorm deny a connection attempt, you should be getting alerts in Nagios. The plugin output for the alert will look something like the following:
Nagios有许多“外部构件”软件包可供使用。外部构件可以扩展Nagios的应用并使之与其他软件集成。
外部构件可用于:
- 通过WEB接口来管理配置文件
- 监控远程主机(*NIX, Windows,等)
- 实现对远程主机的被动检测
- 减化并扩展告警逻辑
- ...和其他更多事情
你可以通过访问如下站点找寻外部构件:
这里对一些我开发的外部构件给一个简洁的介绍...

NRPE是一个可在远程Linux/Unix主机上执行的插件的外部构件包。如果你需要监控远程的主机上的本地资源或属性,如磁盘利用率、CPU负荷、内存利用率等时是很有用的。象是用check_by_ssh插件来实现的功能一样,但是它不需要占用更多的监控主机的CPU负荷-当你需要监控成百上千个主机是这个很重要。
NRPE外部构件包和文档可以在http://www.nagios.org/上找到。

NSCA是一个可在远程Linux/Unix主机上执行被动检测并将结果传给Nagios守护进程的外部构件包。这在分布式和冗余/失效监控的设置时非常有用。
NSCA外部构件包和文档可以在http://www.nagios.org/上找到。

NDOUtils是一个可以把全部状态信息保存到MySQL数据库里的外部构件。外个Nagios的库实例都可以把它们监控的信息保存到统一的中心数据库并集中报告。它将为一个Nagios新的基于PHH的WEB接口程序提供数据源服务。
NDOUtils外部构件包和文档可以在http://www.nagios.org/上找到。
Nagios编译时可以选择支持内嵌Perl解释器。这使得Nagios可以用更高效率来执行Perl所写插件,因而如果严重依赖于Perl写的插件的话可能是个好消息。没有内嵌Perl解释器,Nagios将通过象外部命令一样用派生和执行的方法利用Perl所写的插件。当编译中选择了支持内嵌Perl解释器时,Nagios可以象调用库一样来执行Perl插件。
提示
Stephen Davies contributed the original embedded Perl interpreter code several years back. Stanley Hopcroft has been the primary person helping to improve the embedded Perl interpreter code quite a bit and has commented on the advantages/disadvanges of using it. He has also given several helpful hints on creating Perl plugins that work properly with the embedded interpreter. It should be noted that "ePN", as used in this documentation, refers to embedded Perl Nagios, or if you prefer, Nagios compiled with an embedded Perl interpreter.

Some advantages of ePN (embedded Perl Nagios) include:
- Nagios will spend much less time running your Perl plugins because it no longer forks to execute the plugin (each time loading the Perl interpreter). Instead, it executes your plugin by making a library call.
- It greatly reduces the system impact of Perl plugins and/or allows you to run more checks with Perl plugin than you otherwise would be able to. In other words, you have less incentive to write plugins in other languages such as C/C++, or Expect/TCL, that are generally recognised to have development times at least an order of magnitude slower than Perl (although they do run about ten times faster also - TCL being an exception).
- If you are not a C programmer, then you can still get a huge amount of mileage out of Nagios by letting Perl do all the heavy lifting without having Nagios slow right down. Note however, that the ePN will not speed up your plugin (apart from eliminating the interpreter load time). If you want fast plugins then consider Perl XSUBs (XS), or C after you are sure that your Perl is tuned and that you have a suitable algorithm (Benchmark.pm is invaluable for comparing the performance of Perl language elements).
- Using the ePN is an excellent opportunity to learn more about Perl.
The disadvantages of ePN (embedded Perl Nagios) are much the same as Apache mod_perl (i.e. Apache with an embedded interpreter) compared to a plain Apache:
- A Perl program that works fine with plain Nagios may not work with the ePN. You may have to modify your plugins to get them to work.
- Perl plugins are harder to debug under an ePN than under a plain Nagios.
- Your ePN will have a larger SIZE (memory footprint) than a plain Nagios.
- Some Perl constructs cannot be used or may behave differently than what you would expect.
- You may have to be aware of 'more than one way to do it' and choose a way that seems less attractive or obvious.
- You will need greater Perl knowledge (but nothing very esoteric or stuff about Perl internals - unless your plugin uses XSUBS).
If you want to use the embedded Perl interpreter to run your Perl plugins and scripts, here's what you'll need to do:
- Compile Nagios with support for the embedded Perl interpreter (see instructions below).
- Enable the enable_embedded_perl option in the main configuration file.
- Set the use_embedded_perl_implicitly option to fit your needs. This option determines whether or not the Perl interpreter should be used by default for individual Perl plugins and scripts.
- Optionally enable or disable certain Perl plugins and scripts from being run using the embedded Perl interpreter. This can be useful if certain Perl scripts have problems being running under the Perl interpreter. See instructions below for more information on doing this.
If you want to use the embedded Perl interpreter, you'll first need to compile Nagios with support for it. To do this, simply run the configure script with the addition of the --enable-embedded-perl option. If you want the embedded interpreter to cache internally compiled scripts, add the --with-perlcache option as well. Example:
./configure --enable-embedded-perl --with-perlcache otheroptions...
Once you've rerun the configure script with the new options, make sure to recompile Nagios.
Beginning with Nagios 3, you can specify which Perl plugins or scripts should or should not be run under the embedded Perl interpreter. This is particularly useful if you have troublesome Perl scripts which do not work well with the Perl interpreter.
To explicitly tell Nagios whether or not to use the embedded Perl interpreter for a particular perl script, add one of the following entries to your Perl script/plugin...
To tell Nagios to use the Perl interpreter for a particular script, add this line to the Perl script:
# nagios: +epn
To tell Nagios to NOT use the embedded Perl interpreter for a particular script, add this line to the Perl script:
# nagios: -epn
Either line must be located within the first 10 lines of a script for Nagios to detect it.
提示
Information on developing plugins for use with the embedded Perl interpreter can be found here.
Stanley Hopcroft has worked with the embedded Perl interpreter quite a bit and has commented on the advantages/disadvanges of using it. He has also given several helpful hints on creating Perl plugins that work properly with the embedded interpreter. The majority of this documentation comes from his comments.
It should be noted that "ePN", as used in this documentation, refers to embedded Perl Nagios, or if you prefer, Nagios compiled with an embedded Perl interpreter.
- Average Perl developers; those with an appreciation of the languages powerful features without knowledge of internals or an in depth knowledge of those features.
- Those with a utilitarian appreciation rather than a great depth of understanding.
- If you are happy with Perl objects, name management, data structures, and the debugger, that's probably sufficient.
- Always always generate some output
- Use 'use utils' and import the stuff it exports ($TIMEOUT %ERRORS &print_revision &support)
- Have a look at how the standard Perl plugins do their stuff e.g.
- Always exit with $ERRORS{CRITICAL}, $ERRORS{OK}, etc.
- Use getopt to read command line arguments
- Manage timeouts
- Call print_usage (supplied by you) when there are no command line arguments
- Use standard switch names (eg H 'host', V 'version')
- <DATA> can not be used; use here documents instead e.g.
例 12.1.
my $data = <<DATA;
portmapper 100000
portmap 100000
sunrpc 100000
rpcbind 100000
rstatd 100001
rstat 100001
rup 100001
..
DATA
%prognum = map { my($a, $b) = split; ($a, $b) } split(/\n/, $data) ;
- BEGIN blocks will not work as you expect. May be best to avoid.
- Ensure that it is squeaky clean at compile time i.e.
- use strict
- use perl -w (other switches [T notably] may not help)
- use perl -c
- Avoid lexical variables (my) with global scope as a means of passing __variable__ data into subroutines. In fact this is __fatal__ if the subroutine is called by the plugin more than once when the check is run. Such subroutines act as 'closures' that lock the global lexicals first value into subsequent calls of the subroutine. If however, your global is read-only (a complicated structure for example) this is not a problem. What Bekman recommends you do instead, is any of the following:
- make the subroutine anonymous and call it via a code ref e.g.
例 12.2.
turn this into
my $x = 1 ; my $x = 1 ;
sub a { .. Process $x ... } $a_cr = sub { ... Process $x ... } ;
. .
. .
a ; &$a_cr ;
$x = 2 $x = 2 ;
a ; &$a_cr ;
# anon closures __always__ rebind the current lexical value
- put the global lexical and the subroutine using it in their own package (as an object or a module)
- pass info to subs as references or aliases (\$lex_var or $_[n])
- replace lexicals with package globals and exclude them from 'use strict' objections with 'use vars qw(global1 global2 ..)'
- make the subroutine anonymous and call it via a code ref e.g.
- Be aware of where you can get more information. Useful information can be had from the usual suspects (the O'Reilly books, plus Damien Conways "Object Oriented Perl") but for the really useful stuff in the right context start at Stas Bekman's mod_perl guide at http://perl.apache.org/guide/. This wonderful book sized document has nothing whatsoever about Nagios, but all about writing Perl programs for the embedded Perl interpreter in Apache (ie Doug MacEacherns mod_perl). The perlembed manpage is essential for context and encouragement. On the basis that Lincoln Stein and Doug MacEachern know a thing or two about Perl and embedding Perl, their book 'Writing Apache Modules with Perl and C' is almost certainly worth looking at.
- Be aware that your plugin may return strange values with an ePN and that this is likely to be caused by the problem in item #4 above
- Be prepared to debug via:
- having a test ePN and
- adding print statements to your plugin to display variable values to STDERR (can't use STDOUT)
- adding print statements to p1.pl to display what ePN thinks your plugin is before it tries to run it (vi)
- running the ePN in foreground mode (probably in conjunction with the former recommendations)
- use the 'Deparse' module on your plugin to see how the parser has optimised it and what the interpreter will actually get. (see 'Constants in Perl' by Sean M. Burke, The Perl Journal, Fall 2001)
- Be aware of what ePN is transforming your plugin too, and if all else fails try and debug the transformed version. As you can see below p1.pl rewrites your plugin as a subroutine called 'hndlr' in the package named 'Embed::<something_related_to_your_plugin_file_name>'. Your plugin may be expecting command line arguments in @ARGV so pl.pl also assigns @_ to @ARGV. This in turn gets 'eval' ed and if the eval raises an error (any parse error and run error), the plugin gets chucked out. The following output shows how a test ePN transformed the check_rpc plugin before attempting to execute it. Most of the code from the actual plugin is not shown, as we are interested in only the transformations that the ePN has made to the plugin). For clarity, transformations are shown in red:
例 12.4.
package main;
use subs 'CORE::GLOBAL::exit';
sub CORE::GLOBAL::exit { die "ExitTrap: $_[0]
(Embed::check_5frpc)"; }
package Embed::check_5frpc; sub hndlr { shift(@_);
@ARGV=@_;
#! /usr/bin/perl -w
#
# check_rpc plugin for Nagios
#
# usage:
# check_rpc host service
#
# Check if an rpc serice is registered and running
# using rpcinfo - $proto $host $prognum 2>&1 |";
#
# Use these hosts.cfg entries as examples
#
# command[check_nfs]=/some/path/libexec/check_rpc $HOSTADDRESS$ nfs
# service[check_nfs]=NFS;24x7;3;5;5;unix-admin;60;24x7;1;1;1;;check_rpc
#
# initial version: 3 May 2000 by Truongchinh Nguyen and Karl DeBisschop
# current status: $Revision: 1.17 $
#
# Copyright Notice: GPL
#
... rest of plugin code goes here (it was removed for brevity) ...}
- Don't use 'use diagnostics' in a plugin run by your production ePN. I think it causes__all__ the Perl plugins to return CRITICAL.
- Consider using a mini embedded Perl C program to check your plugin. This is not sufficient to guarantee your plugin will perform Ok with an ePN but if the plugin fails this test it will ceratinly fail with your ePN. [ A sample mini ePN is included in the contrib/ directory of the Nagios distribution for use in testing Perl plugins. Change to the contrib/ directory and type 'make mini_epn' to compile it. It must be executed from the same directory that the p1.pl file resides in (this file is distributed with Nagios). ]
If you're looking at writing your own plugins for Nagios, please make sure to visit these other resources:
- The official Nagios plugin project website
- The official Nagios plugin development guidelines
Scripts and executables must do two things (at a minimum) in order to function as Nagios plugins:
- Exit with one of several possible return values
- Return at least one line of text output to STDOUT
The inner workings of your plugin are unimportant to Nagios. Your plugin could check the status of a TCP port, run a database query, check disk free space, or do whatever else it needs to check something. The details will depend on what needs to be checked - that's up to you.
Nagios determines the status of a host or service by evaluating the return code from plugins. The following tables shows a list of valid return codes, along with their corresponding service or host states.
表 12.1.
| Plugin Return Code | Service State | Host State |
|---|---|---|
| 0 | OK | UP |
| 1 | WARNING | UP or DOWN/UNREACHABLE* |
| 2 | CRITICAL | DOWN/UNREACHABLE |
| 3 | UNKNOWN | DOWN/UNREACHABLE |
Note: If the use_aggressive_host_checking option is enabled, return codes of 1 will result in a host state or DOWN or UNREACHABLE. Otherwise return codes of 1 will result in a host state of UP. The process by which Nagios determines whether or not a host is DOWN or UNREACHABLE is discussed here.
At a minimum, plugins should return at least one of text output. Beginning with Nagios 3, plugins can optionally return multiple lines of output. Plugins may also return optional performance data that can be processed by external applications. The basic format for plugin output is shown below:
TEXT OUTPUT | OPTIONAL PERFDATALONG TEXT LINE 1 LONG TEXT LINE 2 ... LONG TEXT LINE N | PERFDATA LINE 2PERFDATA LINE 3 ... PERFDATA LINE N
The performance data (shown in orange) is optional. If a plugin returns performance data in its output, it must separate the performance data from the other text output using a pipe (|) symbol. Additional lines of long text output (shown in blue) are also optional.
Let's see some examples of possible plugin output...
Case 1: One line of output (text only) Assume we have a plugin that returns one line of output that looks like this:
DISK OK - free space: / 3326 MB (56%);
If this plugin was used to perform a service check, the entire line of output will be stored in the $SERVICEOUTPUT$ macro.
Case 2: One line of output (text and perfdata) A plugin can return optional performance data for use by external applications. To do this, the performance data must be separated from the text output with a pipe (|) symbol like such:
DISK OK - free space: / 3326 MB (56%);.|./=2643MB;5948;5958;0;5968
If this plugin was used to perform a service check, the.red.portion of output (left of the pipe separator) will be stored in the $SERVICEOUTPUT$macro and the.orange.portion of output (right of the pipe separator) will be stored in the $SERVICEPERFDATA$ macro.i
Case 3: Multiple lines of output (text and perfdata) A plugin optionally return multiple lines of both text output and perfdata, like such:
DISK OK - free space: / 3326 MB (56%);.|./=2643MB;5948;5958;0;5968 / 15272 MB (77%); /boot 68 MB (69%); /home 69357 MB (27%); /var/log 819 MB (84%); .|./boot=68MB;88;93;0;98 /home=69357MB;253404;253409;0;253414 /var/log=818MB;970;975;0;980
If this plugin was used to perform a service check, the red portion of first line of output (left of the pipe separator) will be stored in the $SERVICEOUTPUT$ macro. The orange portions of the first and subsequent lines are concatenated (with spaces) are stored in the $SERVICEPERFDATA$ macro. The blue portions of the 2nd - 5th lines of output will be concatenated (with escaped newlines) and stored in $LONGSERVICEOUTPUT$ the macro.
The final contents of each macro are listed below:
表 12.2.
| Macro | Value |
|---|---|
| $SERVICEOUTPUT$ | DISK OK - free space: / 3326 MB (56%); |
| $SERVICEPERFDATA$ | /=2643MB;5948;5958;0;5968./boot=68MB;88;93;0;98./home=69357MB;253404;253409;0;253414./var/log=818MB;970;975;0;980 |
| $LONGSERVICEOUTPUT$ | / 15272 MB (77%);\n/boot 68 MB (69%);\n/var/log 819 MB (84%); |
With regards to multiple lines of output, you have the following options for returning performance data:
- You can choose to return no performance data whatsoever
- You can return performance data on the first line only
- You can return performance data only in subsequent lines (after the first)
- You can return performance data in both the first line and subsequent lines (as shown above)
Nagios will only read the first 4 KB of data that a plugin returns. This is done in order to prevent runaway plugins from dumping megs or gigs of data back to Nagios. This 4 KB output limit is fairly easy to change if you need. Simply edit the value of the MAX_PLUGIN_OUTPUT_LENGTH definition in the include/nagios.h.in file of the source code distribution and recompile Nagios. There's nothing else you need to change!
If you're looking for some example plugins to study, I would recommend that you download the official Nagios plugins and look through the code for various C, Perl, and shell script plugins. Information on obtaining the official Nagios plugins can be found here.
Nagios features an optional embedded Perl interpreter which can speed up the execution of Perl plugins. More information on developing Perl plugins for use with the embedded Perl interpreter can be found here.
通过阅读本书,你可以查找到你所需要的一些关键信息,但并非全部。没办法,因为网络文档总是比源程序的更新速度要慢,不仅仅是nagios软件的在线帮助还是nagios-cn手册,相对于一些问题的收集、回应总是有一个问题的发现、查证、调试、补丁和更新的过程,所以,在充分相信这个文档的同时,也要对其中的某些内容要保持一个清醒的头脑!正如我们对“科学”的态度一样,我们应该“崇尚但不迷信”,只有如此,我们才会对已知的科学问题保持平和的心态来应对,对未知的领域才会充满好奇而不断开拓进取!
Nagios是一款非常优秀的监控类软件,但完全掌握它并不是一件容易的事情。其实,想做好网络的管理本身就不是一件容易的事情,在计算机软硬件和网络技术不断发展的今天,网络管理工作本身就是一件有挑战性的工作。学习Nagios或Nagios-cn的使用并使之为已所用,一般要经历兴趣、磨炼、尝试和梳理几个阶段。
你首先要有足够的兴趣来使用开源社区资源来完成你的网络管理工作,如果不是这样,比如你有机会购买与使用商业网管软件,那你很可能会为开源软件的诸多不足所困绕,在有不少情况下甚至会让你陷入困境;其次,你要有一定的知识背景,比如,对Linux/Windows等操作要熟悉,至于要熟到什么程度就不好定义了,但我并不建议你初学就拿Nagios来上手,比如你是一个高校学生,我并不希望你练习使用它,毕竟它还不象许多软件那样有多本教科书来辅导,也不象字处理程序那样通用,即便一个学生有兴越学习了它又能真正了解它多少呢?尝试是软件学习的必经阶段,网上有很多软件都是建议大家以动手的方式来学习新软件,这也不失为一个好方法,但前提是要对自己的目标有一个相对清楚的认识,举个简单的例子,可以用Nagios对Windows服务器进行监控,如果只是这样一个简单目标,你一定会找到按图索骥找到几个Windows的Agent安装上并开始复杂的配置,然后学习一堆配置方法,写个动手总结之类的文章...但我认为这样并非是一件好事!因为搞清楚网络管理的目标其实是第一要务,对Windows系统监控什么,有哪些状态、参数或曲线要收集,要做些什么响应?搞清楚这些再比较各种对Windows的管理方案,有些只要安装Windows标准控件,有些须自己编写一些本地化脚本,还有一些须在服务器端做些手脚才会有结果,所有这些方法中要找出哪一个最合适方法这才是最重要的,有句笑话“不怕队伍长,就怕站错队”;梳理也是要有的一个阶段,其实总结经验并不断提高使用水平是一件让人痛苦的事情,但往往在这种痛苦中才会感觉到提高与成长,我见到不少网友学习东西很快,比如一种编程语言,可以在三个小时内写出漂亮的程序,但是要再花三个月时间来精通它,却不愿意了,这真是很可惜,也很可怜,因为这些只会使他不断强化“动手强而动脑不足”的毛病,最终无一是处。
所以,我对于本书的阅读建议就是要“有兴趣、头脑清醒、相对充裕的设备条件和一个好记事情的烂笔头”。
采用这种形式来写书,无非是看中了docbook一次实现了三个目标:写一个软件的操作说明入门书、制作一套易于维护的在线手册和出版一篇开源软件介绍文章。在开源世界里,似乎开源软件的服务与开源项目的发展是相互依存的关系,而我写这本书的目标却恰恰是想摆脱软件服务的“杂事”,毕竟软件服务不是我想要做的事情,即便是我所修改的软件也是如此,用一套相对完善的操作说明入门书引导新手来使用软件就可以大大节省软件服务的事宜,而html格式估计是最为直接有效的范本格式了;Nagios项目在Sourceforge站点里是一个相对活跃的项目,它的源程序和操作也在不断地更新,原始项目工程不断地变化就使得翻译工程也得不断变化,而操作书可以不断地随着源工程项目代码不断地翻译更新就须有一个好的文档结构,最后,选来选去,选中了DocBook,虽然它也有一堆的问题!出版一篇开源软件介绍文章最好是从众多的资料当中提炼出精华,有针对性地向网友介绍才会有效果,毕竟一款好的软件的优点还是很多的,需要也必须将它不断地推广应用开来,以最大限度地为民所用。
虽然费了不少心血来准备这本书,但正式印刷出版我却不敢奢望。如果大家觉得不错,还是电子书更新几个版次之后再考虑吧。
建立nagios-cn项目的初衷其实就是想将Nagios软件介绍给国人,让它更好地为国人服务,但考虑到诸多因素,尤其是自身能力所及,我想nagios-cn项目尽可能还是局限于nagios软件主体的使用方面,而对于它的许多外部接口、应用技巧、使用经验等不做涉及。按照Nagios软件作者的想法,3.x版将尽可能引入一些新管理机制,而4.x版本将注得i18n相关工作,我想通过nagios-cn的工作,可以尽可能多地融入Nagios项目,并可以在4.x版本构建过程中提供有益的尝试与帮助。
在3.x版本中,nagios-cn项目将跟踪几次Nagios软件小版本,并非全部。更多的精力将放在对其的界面操作与帮助等的汉化工作上。与Nagios3.x版本对应上,将尽可能第一时间内推出3.0版本的界面汉化的nagios-cn版本,这时可能没办法完成帮助的汉化工作,在3.1或3.2版本,将尽力完成全部内容的汉化工作,在3.4或3.5版本,将把一些汉化后的绘图工具或配置工具融合到nagios-cn项目中,以方便使用,后面就不准备再更新nagios-cn项目了,而是注重积累经验,为Nagios软件的i18n方面提供经验与帮助。如果时间安排得当,在当前条件不变的情况下,估计在2008年内完成全面汉化工作,而在2009年上半年完成相关中文工具的集成。当然,如果有志同道合者参与的话,这一进程可能会快些。
如果你愿意支持Nagios项目或是nagios-cn项目,可以为开源社区Sourceforge.net提供捐助,或是把钱捐助给中国的希望工程。
如果只对nagios-cn项目提供帮助,可以捐助给我,一次最少20元,最多200元人民币,给这个银行帐号:
中国建设银行 上海 4367421217260717897 田朝阳
捐助后请给我写个email写清楚你的名字,邮件地址是zytian@gmail.com,我将非常感谢你对项目的支持,并尽早地将你所给的捐助全部转赠中国希望工程或中国宋庆龄基金会并邮件通知您,我个人不需要您的捐助。
须提醒的是,nagios-cn和Nagios软件一样采用GNU版权,这意味着如果你没有商业销售获利,你必须将这个软件的源代码以可见的、同步地复制给你的用户,使他也可以得到该软件的全部代码而不是部分,如果你想商业化应用它,以此获取商业利益或以此为基础获取有尝服务利益,则须向Nagios软件的版权所有者获取商业版权才可能发行它。而我并不会也不能授理Nagios软件的商业授权行为,尤其是公司以此进行相关的商业化销售时更要注意,在你取得了Nagios软件的商业许可后,可以与我联系nagios-cn项目的商业授权事宜,对项目定向捐助不可以替代商业授权。