插件是编译的执行文件或脚本(Perl脚本、SHELL脚本等等),可以在命令行下执行对主机或服务的状态检查。Nagios运行这些插件的检测结果来决定网络中的主机和服务的当前状态。
当需要检测主机或服务的状态时Nagios总是执行一个插件程序,插件总要做点事情(注意一般条件下)来完成检查并给出简洁的结果给Nagios。Nagios将处理这些来自插件的结果并做些该做的动作(运行事件处理句柄、发送出告警等)。
插件扮演了位于Nagios守护程序里的监控逻辑和实际被监控的主机与服务之间的抽象层次。
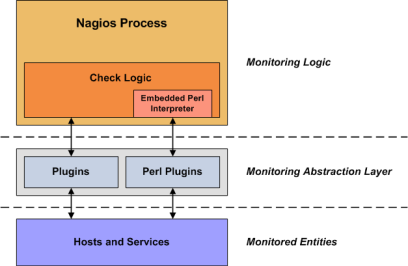
在插件构架之上你可以监控所有你想要监控的东西。如果你能自动地处理检测过程你就可以用Nagios来监控它。已经写好很多插件以用于监控基础性资源象处理器负荷、磁盘利用率、PING包率等,如果你想监控点别的,你需要查阅书写插件这篇文档并自己付出努力,这很简单地!
在插件构架之下,事实上Nagios也不知道你想要搞些什么名堂。你可以监控网络流量态势、数据错包率、房间温度、CPU电压值、风扇转速、处理器负载、磁盘空间或是有可能在早上起来你的超级无敌的面包机烤出正宗的色泽...Nagios不会理解什么被监控了-它只是忠实地记录下了这些被管理资源的状态变化轨迹。只有插件自已知道监控了什么东西并如何完成检测。
有许多插件可用于监控不同的设备和服务,包括:
- HTTP、POP3、IMAP、FTP、SSH、DHCP
- CPU负荷、磁盘利用率、内存占用、当前用户数
- Unix/Linux、Windows和Netware服务器
- 路由器和交换机
- 等等
插件不与Nagios包一起发布,但你可以下载到Nagios官方插件和由Nagios用户书写并维护的额外插 件,在这些网址里:
- Nagios Plugins工程http://nagiosplug.sourceforge.net/
- Nagios下载页面http://www.nagios.org/download/
- NagiosExchange.orghttp://www.nagiosexchange.org/
当你在命令行下用命令参数-h或-help运行时许多插件会显示基本用法信息。例如如果你想知道如何使用check_http插件或是它的可接收哪些选项参数时,你只要尝试运行:
./check_http --help
就可以看到提示内容了。
你可以在这里找到有关插件技术论述的信息并且有如何书写你自己定制插件的内容。
在Nagios执行命令之前,它将对命令里的每个宏替换成它们应当取得的值。这种宏替换发生在Nagios在执行各种类型的宏时候 - 象主机和服务的检测、通知、事件处理等。
有些特定的宏包含了其他宏,这些宏包括$HOSTNOTES$、$HOSTNOTESURL$、$HOSTACTIONURL$、$SERVICENOTES$、$SERVICENOTESURL$和$SERVICEACTIONURL$。
当在命令定义中使用主机或服务宏时,宏将要执行所用的值是指向主机或服务所带有值。尝试这个例子,假定在check_ping命令定义里使用了一个主机对象,象这样:
define host{
		host_name		linuxbox
		address		192.168.1.2
		check_command	check_ping
		...
		}
		define command{
		command_name    check_ping
		command_line    /usr/local/nagios/libexec/check_ping -H $HOSTADDRESS$ -w 100.0,90% -c 200.0,60%
		}
那么执行这个主机检测命令时展开并最终执行的将是这样的:
/usr/local/nagios/libexec/check_ping -H 192.168.1.2 -w 100.0,90% -c 200.0,60%
很简单,对吧?优美之处在于你可以在只用一个命令定义来完成无限制的多个主机的检测。每个主机可以使用相同的命令来进行检测,而在对他们检测之前将把主机地址正确地替换。
同样你可以向命令传递参数,这样可以保证你的命令定义更具通用性。参数指定在对象(象主机或服务)中定义,用一个“!”来分隔他们,象这样:
define service{
		host_name		linuxbox
		service_description	PING
		check_command	check_ping!200.0,80%!400.0,40%
		...
		}
在上例中,服务的检测命令中含有两个参数(请参考$ARGn$宏),而$ARG1$宏将是"200.0,80%",同时$ARG2$将是"400.0,40%"(都不带引号)。假定使用之前的主机定义并这样来定义你的check_ping命令:
define command{
		command_name    check_ping
		command_line    /usr/local/nagios/libexec/check_ping -H $HOSTADDRESS$ -w $ARG1$ -c $ARG2$
		}
那么对于服务的检测命令最终将是这样子的:
/usr/local/nagios/libexec/check_ping -H 192.168.1.2 -w 200.0,80% -c 400.0,40%
提示

如果你需要在你的命令行里使用这个(!)字符,你得加上转义符反斜线(\),就是你要写成(\!)。如果想用反斜线,同样得加转义符,写成(\\)。
通常在在命令对象定义里使用主机和服务的宏,用以在命令执行时指向某个服务或是主机。但也就是说,一个在对命名为linuxbox的主机上执行命令时,全部的标准的主机宏都应使用这个主机值都是正运行的主机名linuxbox。
如果不想这样,也是是让命令里引用的主机或服务宏指向另外一些主机或服务,你可以用“按需生成的宏”的机制。除了那个需要指定从哪个给主机或服务时取值而包含在内的标识之外,按需而成的宏看起来就象是一般的宏。这里是基本的“按需而成的宏”的基本格式:
- $HOSTMACRONAME:host_name$
- $SERVICEMACRONAME:host_name:service_description$
用标准的主机和服务的宏名字替换HOSTMACRONAME和SERVICEMACRONAME,这些标准的宏可以在这里查到。
要注意宏的名字与主机和服务的标识之间隔有一个(:)符号。为了形成表达按需而成的服务宏的标识,在标识里既有主机名又有服务描述-他们俩用一个(:)符号分开。
提示
按需而成的服务宏可以包含主机名域为空,此时所绑定的主机由服务结合情况自行来指定。
下面是按需而成的主机和服务宏的例子:
		$HOSTDOWNTIME:myhost$                        <--- On-demand host macro
		$SERVICESTATEID:novellserver:DS Database$    <--- On-demand service macro
		$SERVICESTATEID::CPU Load$                   <--- On-demand service macro with blank host name field
按需而成的宏同样可以运用于主机组、服务组、联系人和联系人组宏里,例如:
		$CONTACTEMAIL:john$                          <--- On-demand contact macro
		$CONTACTGROUPMEMBERS:linux-admins$           <--- On-demand contactgroup macro
		$HOSTGROUPALIAS:linux-servers$               <--- On-demand hostgroup macro
		$SERVICEGROUPALIAS:DNS-Cluster$              <--- On-demand servicegroup macro
在主机、服务或联系人等对象里的任何一个用户自定制变量都可以联接宏。用户自定制的变量宏命名如下:
- $_HOSTvarname$
- $_SERVICEvarname$
- $_CONTACTvarname$
如下的主机对象定义中定义了一个用户自定制变量是"_MACADDRESS",见细节:
define host{
		host_name		linuxbox
		address		192.168.1.1
		_MACADDRESS	00:01:02:03:04:05
		...
		}
那么主机对象的_MACADDRESS用户自定制变量的值就可以在宏$_HOSTMACADDRESS$里面使用。你可以在这里找到更多的关于用户自定制变量以及如何在宏里使用它的信息。
在命令执行之前,有些宏要去掉那些可能会引起SHELL潜在风险的元字符。这些元字符由illegal_macro_output_chars选项来定义。下面这些宏是要做这种处理的:
由Nagios将宏变成一个操作系统的环境变量将有利于在脚本或命令执行时引用。为保证安全和清晰的思路,$USERn$和"按需而成on-demand"的主机和服务宏是不可以被作为环境变量的。
环境变量的命名与其包含的命名标准宏(列表在这里)的名字是相关的,它们的名字前面加前缀"NAGIOS_"。比如说$HOSTNAME$宏在环境变量里被命名为"NAGIOS_HOSTNAME".
所有的在Nagios里的可用的宏以及如何使用它们的列表可以在这里查找。
这里列出了Nagios里可用的标准宏。按需生成的宏和用户定制变量宏在这篇文档里有说明。
虽然宏可被用于定义的各种命令之中,但并非每种宏在特定环境里是“合法”的。如,有些宏只是在服务通知命令里有效,而另外一些只在主机检测命令里有用。Nagios可以辨识和处理的情况有十种不同类型,它们就是:
下面表格中列出了在Nagios可用的全部的宏,并且每个宏都有一个简短说明及什么样命令是有效的。如果宏在无效的命令中使用,可能会被空串替代。须注意全部宏是大写字符且名字里最前和最后都有$字符。
表 8.2. 主机宏:3
| 宏名 | 服务检测 | 服务通知 | 主机检测 | 主机通知 | 服务事件处理与OCSP | 主机事件处理与OCHP | 服务性能 | 主机性能 |
|---|---|---|---|---|---|---|---|---|
| $HOSTNAME$ | Yes | Yes | Yes | Yes | Yes | Yes | Yes | Yes |
| $HOSTDISPLAYNAME$ | Yes | Yes | Yes | Yes | Yes | Yes | Yes | Yes |
| $HOSTALIAS$ | Yes | Yes | Yes | Yes | Yes | Yes | Yes | Yes |
| $HOSTADDRESS$ | Yes | Yes | Yes | Yes | Yes | Yes | Yes | Yes |
| $HOSTSTATE$ | Yes | Yes | Yes 1 | Yes | Yes | Yes | Yes | Yes |
| $HOSTSTATEID$ | Yes | Yes | Yes 1 | Yes | Yes | Yes | Yes | Yes |
| $LASTHOSTSTATE$ | Yes | Yes | Yes | Yes | Yes | Yes | Yes | Yes |
| $LASTHOSTSTATEID$ | Yes | Yes | Yes | Yes | Yes | Yes | Yes | Yes |
| $HOSTSTATETYPE$ | Yes | Yes | Yes 1 | Yes | Yes | Yes | Yes | Yes |
| $HOSTATTEMPT$ | Yes | Yes | Yes | Yes | Yes | Yes | Yes | Yes |
| $MAXHOSTATTEMPTS$ | Yes | Yes | Yes | Yes | Yes | Yes | Yes | Yes |
| $HOSTEVENTID$ | Yes | Yes | Yes | Yes | Yes | Yes | Yes | Yes |
| $LASTHOSTEVENTID$ | Yes | Yes | Yes | Yes | Yes | Yes | Yes | Yes |
| $HOSTPROBLEMID$ | Yes | Yes | Yes | Yes | Yes | Yes | Yes | Yes |
| $LASTHOSTPROBLEMID$ | Yes | Yes | Yes | Yes | Yes | Yes | Yes | Yes |
| $HOSTLATENCY$ | Yes | Yes | Yes | Yes | Yes | Yes | Yes | Yes |
| $HOSTEXECUTIONTIME$ | Yes | Yes | Yes 1 | Yes | Yes | Yes | Yes | Yes |
| $HOSTDURATION$ | Yes | Yes | Yes | Yes | Yes | Yes | Yes | Yes |
| $HOSTDURATIONSEC$ | Yes | Yes | Yes | Yes | Yes | Yes | Yes | Yes |
| $HOSTDOWNTIME$ | Yes | Yes | Yes | Yes | Yes | Yes | Yes | Yes |
| $HOSTPERCENTCHANGE$ | Yes | Yes | Yes | Yes | Yes | Yes | Yes | Yes |
| $HOSTGROUPNAME$ | Yes | Yes | Yes | Yes | Yes | Yes | Yes | Yes |
| $HOSTGROUPNAMES$ | Yes | Yes | Yes | Yes | Yes | Yes | Yes | Yes |
| $LASTHOSTCHECK$ | Yes | Yes | Yes | Yes | Yes | Yes | Yes | Yes |
| $LASTHOSTSTATECHANGE$ | Yes | Yes | Yes | Yes | Yes | Yes | Yes | Yes |
| $LASTHOSTUP$ | Yes | Yes | Yes | Yes | Yes | Yes | Yes | Yes |
| $LASTHOSTDOWN$ | Yes | Yes | Yes | Yes | Yes | Yes | Yes | Yes |
| $LASTHOSTUNREACHABLE$ | Yes | Yes | Yes | Yes | Yes | Yes | Yes | Yes |
| $HOSTOUTPUT$ | Yes | Yes | Yes 1 | Yes | Yes | Yes | Yes | Yes |
| $LONGHOSTOUTPUT$ | Yes | Yes | Yes 1 | Yes | Yes | Yes | Yes | Yes |
| $HOSTPERFDATA$ | Yes | Yes | Yes 1 | Yes | Yes | Yes | Yes | Yes |
| $HOSTCHECKCOMMAND$ | Yes | Yes | Yes | Yes | Yes | Yes | Yes | Yes |
| $HOSTACKAUTHOR$8 | No | No | No | Yes | No | No | No | No |
| $HOSTACKAUTHORNAME$8 | No | No | No | Yes | No | No | No | No |
| $HOSTACKAUTHORALIAS$8 | No | No | No | Yes | No | No | No | No |
| $HOSTACKCOMMENT$8 | No | No | No | Yes | No | No | No | No |
| $HOSTACTIONURL$ | Yes | Yes | Yes | Yes | Yes | Yes | Yes | Yes |
| $HOSTNOTESURL$ | Yes | Yes | Yes | Yes | Yes | Yes | Yes | Yes |
| $HOSTNOTES$ | Yes | Yes | Yes | Yes | Yes | Yes | Yes | Yes |
| $TOTALHOSTSERVICES$ | Yes | Yes | Yes | Yes | Yes | Yes | Yes | Yes |
| $TOTALHOSTSERVICESOK$ | Yes | Yes | Yes | Yes | Yes | Yes | Yes | Yes |
| $TOTALHOSTSERVICESWARNING$ | Yes | Yes | Yes | Yes | Yes | Yes | Yes | Yes |
| $TOTALHOSTSERVICESUNKNOWN$ | Yes | Yes | Yes | Yes | Yes | Yes | Yes | Yes |
| $TOTALHOSTSERVICESCRITICAL$ | Yes | Yes | Yes | Yes | Yes | Yes | Yes | Yes |
表 8.4. 服务宏:
| 宏名 | 服务检测 | 服务通知 | 主机检测 | 主机通知 | 服务事件处理与OCSP | 主机事件处理与OCHP | 服务性能 | 主机性能 |
|---|---|---|---|---|---|---|---|---|
| $SERVICEDESC$ | Yes | Yes | No | No | Yes | No | Yes | No |
| $SERVICEDISPLAYNAME$ | Yes | Yes | No | No | Yes | No | Yes | No |
| $SERVICESTATE$ | Yes 2 | Yes | No | No | Yes | No | Yes | No |
| $SERVICESTATEID$ | Yes 2 | Yes | No | No | Yes | No | Yes | No |
| $LASTSERVICESTATE$ | Yes | Yes | No | No | Yes | No | Yes | No |
| $LASTSERVICESTATEID$ | Yes | Yes | No | No | Yes | No | Yes | No |
| $SERVICESTATETYPE$ | Yes | Yes | No | No | Yes | No | Yes | No |
| $SERVICEATTEMPT$ | Yes | Yes | No | No | Yes | No | Yes | No |
| $MAXSERVICEATTEMPTS$ | Yes | Yes | No | No | Yes | No | Yes | No |
| $SERVICEISVOLATILE$ | Yes | Yes | No | No | Yes | No | Yes | No |
| $SERVICEEVENTID$ | Yes | Yes | No | No | Yes | No | Yes | No |
| $LASTSERVICEEVENTID$ | Yes | Yes | No | No | Yes | No | Yes | No |
| $SERVICEPROBLEMID$ | Yes | Yes | No | No | Yes | No | Yes | No |
| $LASTSERVICEPROBLEMID$ | Yes | Yes | No | No | Yes | No | Yes | No |
| $SERVICELATENCY$ | Yes | Yes | No | No | Yes | No | Yes | No |
| $SERVICEEXECUTIONTIME$ | Yes 2 | Yes | No | No | Yes | No | Yes | No |
| $SERVICEDURATION$ | Yes | Yes | No | No | Yes | No | Yes | No |
| $SERVICEDURATIONSEC$ | Yes | Yes | No | No | Yes | No | Yes | No |
| $SERVICEDOWNTIME$ | Yes | Yes | No | No | Yes | No | Yes | No |
| $SERVICEPERCENTCHANGE$ | Yes | Yes | No | No | Yes | No | Yes | No |
| $SERVICEGROUPNAME$ | Yes | Yes | No | No | Yes | No | Yes | No |
| $SERVICEGROUPNAMES$ | Yes | Yes | No | No | Yes | No | Yes | No |
| $LASTSERVICECHECK$ | Yes | Yes | No | No | Yes | No | Yes | No |
| $LASTSERVICESTATECHANGE$ | Yes | Yes | No | No | Yes | No | Yes | No |
| $LASTSERVICEOK$ | Yes | Yes | No | No | Yes | No | Yes | No |
| $LASTSERVICEWARNING$ | Yes | Yes | No | No | Yes | No | Yes | No |
| $LASTSERVICEUNKNOWN$ | Yes | Yes | No | No | Yes | No | Yes | No |
| $LASTSERVICECRITICAL$ | Yes | Yes | No | No | Yes | No | Yes | No |
| $SERVICEOUTPUT$ | Yes 2 | Yes | No | No | Yes | No | Yes | No |
| $LONGSERVICEOUTPUT$ | Yes 2 | Yes | No | No | Yes | No | Yes | No |
| $SERVICEPERFDATA$ | Yes 2 | Yes | No | No | Yes | No | Yes | No |
| $SERVICECHECKCOMMAND$ | Yes | Yes | No | No | Yes | No | Yes | No |
| $SERVICEACKAUTHOR$8 | No | Yes | No | No | No | No | No | No |
| $SERVICEACKAUTHORNAME$8 | No | Yes | No | No | No | No | No | No |
| $SERVICEACKAUTHORALIAS$8 | No | Yes | No | No | No | No | No | No |
| $SERVICEACKCOMMENT$8 | No | Yes | No | No | No | No | No | No |
| $SERVICEACTIONURL$ | Yes | Yes | No | No | Yes | No | Yes | No |
| $SERVICENOTESURL$ | Yes | Yes | No | No | Yes | No | Yes | No |
| $SERVICENOTES$ | Yes | Yes | No | No | Yes | No | Yes | No |
表 8.8. 汇总统计宏:
| 宏名 | 服务检测 | 服务通知 | 主机检测 | 主机通知 | 服务事件处理与OCSP | 主机事件处理与OCHP | 服务性能 | 主机性能 |
|---|---|---|---|---|---|---|---|---|
| $TOTALHOSTSUP$10 | Yes | Yes 4 | Yes | Yes 4 | Yes | Yes | Yes | Yes |
| $TOTALHOSTSDOWN$10 | Yes | Yes 4 | Yes | Yes 4 | Yes | Yes | Yes | Yes |
| $TOTALHOSTSUNREACHABLE$10 | Yes | Yes 4 | Yes | Yes 4 | Yes | Yes | Yes | Yes |
| $TOTALHOSTSDOWNUNHANDLED$10 | Yes | Yes 4 | Yes | Yes 4 | Yes | Yes | Yes | Yes |
| $TOTALHOSTSUNREACHABLEUNHANDLED$10 | Yes | Yes 4 | Yes | Yes 4 | Yes | Yes | Yes | Yes |
| $TOTALHOSTPROBLEMS$10 | Yes | Yes 4 | Yes | Yes 4 | Yes | Yes | Yes | Yes |
| $TOTALHOSTPROBLEMSUNHANDLED$10 | Yes | Yes 4 | Yes | Yes 4 | Yes | Yes | Yes | Yes |
| $TOTALSERVICESOK$10 | Yes | Yes 4 | Yes | Yes 4 | Yes | Yes | Yes | Yes |
| $TOTALSERVICESWARNING$10 | Yes | Yes 4 | Yes | Yes 4 | Yes | Yes | Yes | Yes |
| $TOTALSERVICESCRITICAL$10 | Yes | Yes 4 | Yes | Yes 4 | Yes | Yes | Yes | Yes |
| $TOTALSERVICESUNKNOWN$10 | Yes | Yes 4 | Yes | Yes 4 | Yes | Yes | Yes | Yes |
| $TOTALSERVICESWARNINGUNHANDLED$10 | Yes | Yes 4 | Yes | Yes 4 | Yes | Yes | Yes | Yes |
| $TOTALSERVICESCRITICALUNHANDLED$10 | Yes | Yes 4 | Yes | Yes 4 | Yes | Yes | Yes | Yes |
| $TOTALSERVICESUNKNOWNUNHANDLED$10 | Yes | Yes 4 | Yes | Yes 4 | Yes | Yes | Yes | Yes |
| $TOTALSERVICEPROBLEMS$10 | Yes | Yes 4 | Yes | Yes 4 | Yes | Yes | Yes | Yes |
| $TOTALSERVICEPROBLEMSUNHANDLED$10 | Yes | Yes 4 | Yes | Yes 4 | Yes | Yes | Yes | Yes |
表 8.9. 通知宏:
| 宏名 | 服务检测 | 服务通知 | 主机检测 | 主机通知 | 服务事件处理与OCSP | 主机事件处理与OCHP | 服务性能 | 主机性能 |
|---|---|---|---|---|---|---|---|---|
| $NOTIFICATIONTYPE$ | No | Yes | No | Yes | No | No | No | No |
| $NOTIFICATIONRECIPIENTS$ | No | Yes | No | Yes | No | No | No | No |
| $NOTIFICATIONISESCALATED$ | No | Yes | No | Yes | No | No | No | No |
| $NOTIFICATIONAUTHOR$ | No | Yes | No | Yes | No | No | No | No |
| $NOTIFICATIONAUTHORNAME$ | No | Yes | No | Yes | No | No | No | No |
| $NOTIFICATIONAUTHORALIAS$ | No | Yes | No | Yes | No | No | No | No |
| $NOTIFICATIONCOMMENT$ | No | Yes | No | Yes | No | No | No | No |
| $HOSTNOTIFICATIONNUMBER$ | No | Yes | No | Yes | No | No | No | No |
| $HOSTNOTIFICATIONID$ | No | Yes | No | Yes | No | No | No | No |
| $SERVICENOTIFICATIONNUMBER$ | No | Yes | No | Yes | No | No | No | No |
| $SERVICENOTIFICATIONID$ | No | Yes | No | Yes | No | No | No | No |
表 8.11. 文件宏:
| 宏名 | 服务检测 | 服务通知 | 主机检测 | 主机通知 | 服务事件处理与OCSP | 主机事件处理与OCHP | 服务性能 | 主机性能 |
|---|---|---|---|---|---|---|---|---|
| $MAINCONFIGFILE$ | Yes | Yes | Yes | Yes | Yes | Yes | Yes | Yes |
| $STATUSDATAFILE$ | Yes | Yes | Yes | Yes | Yes | Yes | Yes | Yes |
| $COMMENTDATAFILE$ | Yes | Yes | Yes | Yes | Yes | Yes | Yes | Yes< 5 |
| $DOWNTIMEDATAFILE$ | Yes | Yes | Yes | Yes | Yes | Yes | Yes | Yes |
| $RETENTIONDATAFILE$ | Yes | Yes | Yes | Yes | Yes | Yes | Yes | Yes |
| $OBJECTCACHEFILE$ | Yes | Yes | Yes | Yes | Yes | Yes | Yes | Yes |
| $TEMPFILE$ | Yes | Yes | Yes | Yes | Yes | Yes | Yes | Yes |
| $TEMPPATH$ | Yes | Yes | Yes | Yes | Yes | Yes | Yes | Yes |
| $LOGFILE$ | Yes | Yes | Yes | Yes | Yes | Yes | Yes | Yes |
| $RESOURCEFILE$ | Yes | Yes | Yes | Yes | Yes | Yes | Yes | Yes |
| $COMMANDFILE$ | Yes | Yes | Yes | Yes | Yes | Yes | Yes | Yes |
| $HOSTPERFDATAFILE$ | Yes | Yes | Yes | Yes | Yes | Yes | Yes | Yes |
| $SERVICEPERFDATAFILE$ | Yes | Yes | Yes | Yes | Yes | Yes | Yes | Yes |
表 8.13. 主机宏:3
| $HOSTNAME$ | 主机简称(如"biglinuxbox"),取自于主机定义里的host_name域。 |
| $HOSTDISPLAYNAME$ | 可供替代显示的主机名,取自于主机定义里的display_name域。 |
| $HOSTALIAS$ | 主机全称、匿名或是描述,取自于主机定义里的alias域。 |
| $HOSTADDRESS$ | 主机地址。取自于主机定义里的address域。 |
| $HOSTSTATE$ | 当前主机状态的说明字符串("运行"、"宕机"或"不可达")。 |
| $HOSTSTATEID$ | 当前主机状态的标识数字(0=运行、1=宕机、2=不可达)。 |
| $LASTHOSTSTATE$ | 最后主机状态的说明字符串("运行", "宕机"或"不可达")。 |
| $LASTHOSTSTATEID$ | 最后主机状态的标识数字(0=运行、1=宕机、2=不可达)。 |
| $HOSTSTATETYPE$ | 主机检测时指示主机当前状态类型的字符串("硬态"或"软态")。软态是指当主机检测返回一个非正常状态并且开始进行重试时所处状态的状态类型。硬态是指当主机检测已经达到最大检测次数后所处的状态的状态类型。 |
| $HOSTATTEMPT$ | 主机检测当前的重试次数。比如,如果第二次要进行重检测,该宏的值是2。当前尝试次数只是反应出当主机事件处理处于软态时基于重试次数内执行指定动作的重试次数。 |
| $MAXHOSTATTEMPTS$ | 最大重试次数由当前主机对象定义给出。当写入软态时的主机事件处理做指定动作的重试时将会用到。 |
| $HOSTEVENTID$ | 全局的唯一ID值,指示当前主机状态,每次主机或服务经历一次状态变换,全局的事件ID计数器增1。如果主机没有经历状态变换,该值将置为0。 |
| $LASTHOSTEVENTID$ | 给定主机的前一个(全局唯一的)事件ID值。 |
| $HOSTPROBLEMID$ | 全局分配的主机当前故障状态的唯一标识值。每次主机(或服务)自一个运行(UP)或正常(OK)状态变换到故障状态时,全局故障ID值会增1。如果主机当前是非运行状态该宏将是一个非零值。主机状态在两个非运行状态(如宕机到不可达)之间变换时将不会导致全局故障ID值增1。如果主机当前处于运行状态,该宏将被置0。与事件处理相结合,该宏将可被用于当主机首次进入故障状态时系统自动地打开一个事故操作票。 |
| $LASTHOSTPROBLEMID$ | 对指定主机的前一次全局唯一故障ID值。与事件处理相结合,该宏将用于当主机恢复到运行状态时自动地关闭一个事故操作票。 |
| $HOSTLATENCY$ | 一个浮点数值的秒数,该值记录了预期的主机检测迟后于它计划检测时间的秒数。比如,如果计划检测时间是03:14:15但直到另一时刻03:14:17才执行时,这个数据将是2.0秒。按需地主机检测有一个0秒的迟后。 |
| $HOSTEXECUTIONTIME$ | A (floating point) number indicating the number of seconds that the host check took to execute (i.e. the amount of time the check was executing). |
| $HOSTDURATION$ | A string indicating the amount of time that the host has spent in its current state. Format is "XXh YYm ZZs", indicating hours, minutes and seconds. |
| $HOSTDURATIONSEC$ | A number indicating the number of seconds that the host has spent in its current state. |
| $HOSTDOWNTIME$ | A number indicating the current "downtime depth" for the host. If this host is currently in a period of scheduled downtime, the value will be greater than zero. If the host is not currently in a period of downtime, this value will be zero. |
| $HOSTPERCENTCHANGE$ | A (floating point) number indicating the percent state change the host has undergone. Percent state change is used by the flap detection algorithm. |
| $HOSTGROUPNAME$ | The short name of the hostgroup that this host belongs to. This value is taken from the hostgroup_name directive in the hostgroup definition. If the host belongs to more than one hostgroup this macro will contain the name of just one of them. |
| $HOSTGROUPNAMES$ | A comma separated list of the short names of all the hostgroups that this host belongs to. |
| $LASTHOSTCHECK$ | This is a timestamp in time_t format (UNIX系统的秒计数器) indicating the time at which a check of the host was last performed. |
| $LASTHOSTSTATECHANGE$ | This is a timestamp in time_t format (UNIX系统的秒计数器) indicating the time the host last changed state. |
| $LASTHOSTUP$ | This is a timestamp in time_t format (UNIX系统的秒计数器) indicating the time at which the host was last detected as being in an UP state. |
| $LASTHOSTDOWN$ | This is a timestamp in time_t format (UNIX系统的秒计数器) indicating the time at which the host was last detected as being in a DOWN state. |
| $LASTHOSTUNREACHABLE$ | This is a timestamp in time_t format (UNIX系统的秒计数器) indicating the time at which the host was last detected as being in an UNREACHABLE state. |
| $HOSTOUTPUT$ | The first line of text output from the last host check (i.e. "Ping OK"). |
| $LONGHOSTOUTPUT$ | The full text output (aside from the first line) from the last host check. |
| $HOSTPERFDATA$ | This macro contains any performance data that may have been returned by the last host check. |
| $HOSTCHECKCOMMAND$ | This macro contains the name of the command (along with any arguments passed to it) used to perform the host check. |
| $HOSTACKAUTHOR$8 | A string containing the name of the user who acknowledged the host problem. This macro is only valid in notifications where the $NOTIFICATIONTYPE$ macro is set to "ACKNOWLEDGEMENT". |
| $HOSTACKAUTHORNAME$8 | A string containing the short name of the contact (if applicable) who acknowledged the host problem. This macro is only valid in notifications where the $NOTIFICATIONTYPE$ macro is set to "ACKNOWLEDGEMENT". |
| $HOSTACKAUTHORALIAS$8 | A string containing the alias of the contact (if applicable) who acknowledged the host problem. This macro is only valid in notifications where the $NOTIFICATIONTYPE$ macro is set to "ACKNOWLEDGEMENT". |
| $HOSTACKCOMMENT$8 | A string containing the acknowledgement comment that was entered by the user who acknowledged the host problem. This macro is only valid in notifications where the $NOTIFICATIONTYPE$ macro is set to "ACKNOWLEDGEMENT". |
| $HOSTACTIONURL$ | Action URL for the host. This macro may contain other macros (e.g. $HOSTNAME$), which can be useful when you want to pass the host name to a web page. |
| $HOSTNOTESURL$ | Notes URL for the host. This macro may contain other macros (e.g. $HOSTNAME$), which can be useful when you want to pass the host name to a web page. |
| $HOSTNOTES$ | Notes for the host. This macro may contain other macros (e.g. $HOSTNAME$), which can be useful when you want to host-specific status information, etc. in the description. |
| $TOTALHOSTSERVICES$ | The total number of services associated with the host. |
| $TOTALHOSTSERVICESOK$ | The total number of services associated with the host that are in an OK state. |
| $TOTALHOSTSERVICESWARNING$ | The total number of services associated with the host that are in a WARNING state. |
| $TOTALHOSTSERVICESUNKNOWN$ | The total number of services associated with the host that are in an UNKNOWN state. |
| $TOTALHOSTSERVICESCRITICAL$ | The total number of services associated with the host that are in a CRITICAL state. |
表 8.14. 主机组宏:5
| $HOSTGROUPALIAS$5 | The long name / alias of either 1) the hostgroup name passed as an on-demand macro argument or 2) the primary hostgroup associated with the current host (if not used in the context of an on-demand macro). This value is taken from the alias directive in the hostgroup definition. |
| $HOSTGROUPMEMBERS$5 | A comma-separated list of all hosts that belong to either 1) the hostgroup name passed as an on-demand macro argument or 2) the primary hostgroup associated with the current host (if not used in the context of an on-demand macro). |
| $HOSTGROUPNOTES$5 | The notes associated with either 1) the hostgroup name passed as an on-demand macro argument or 2) the primary hostgroup associated with the current host (if not used in the context of an on-demand macro). This value is taken from the notes directive in the hostgroup definition. |
| $HOSTGROUPNOTESURL$5 | The notes URL associated with either 1) the hostgroup name passed as an on-demand macro argument or 2) the primary hostgroup associated with the current host (if not used in the context of an on-demand macro). This value is taken from the notes_url directive in the hostgroup definition. |
| $HOSTGROUPNOTES$5 | The action URL associated with either 1) the hostgroup name passed as an on-demand macro argument or 2) the primary hostgroup associated with the current host (if not used in the context of an on-demand macro). This value is taken from the action_url directive in the hostgroup definition. |
表 8.15. 服务宏:
| $SERVICEDESC$ | The long name/description of the service (i.e. "Main Website"). This value is taken from the description directive of the service definition. |
| $SERVICEDISPLAYNAME$ | An alternate display name for the service. This value is taken from the display_name directive in the service definition. |
| $SERVICESTATE$ | A string indicating the current state of the service ("OK", "WARNING", "UNKNOWN", or "CRITICAL"). |
| $SERVICESTATEID$ | A number that corresponds to the current state of the service: 0=OK, 1=WARNING, 2=CRITICAL, 3=UNKNOWN. |
| $LASTSERVICESTATE$ | A string indicating the last state of the service ("OK", "WARNING", "UNKNOWN", or "CRITICAL"). |
| $LASTSERVICESTATEID$ | A number that corresponds to the last state of the service: 0=OK, 1=WARNING, 2=CRITICAL, 3=UNKNOWN. |
| $SERVICESTATETYPE$ | A string indicating the state type for the current service check ("HARD" or "SOFT"). Soft states occur when service checks return a non-OK state and are in the process of being retried. Hard states result when service checks have been checked a specified maximum number of times. |
| $SERVICEATTEMPT$ | The number of the current service check retry. For instance, if this is the second time that the service is being rechecked, this will be the number two. Current attempt number is really only useful when writing service event handlers for "soft" states that take a specific action based on the service retry number. |
| $MAXSERVICEATTEMPTS$ | The max check attempts as defined for the current service. Useful when writing host event handlers for "soft" states that take a specific action based on the service retry number. |
| $SERVICEISVOLATILE$ | Indicates whether the service is marked as being volatile or not: 0 = not volatile, 1 = volatile. |
| $SERVICEEVENTID$ | A globally unique number associated with the service's current state. Every time a a service (or host) experiences a state change, a global event ID number is incremented by one (1). If a service has experienced no state changes, this macro will be set to zero (0). |
| $LASTSERVICEEVENTID$ | The previous (globally unique) event number that given to the service. |
| $SERVICEPROBLEMID$ | A globally unique number associated with the service's current problem state. Every time a service (or host) transitions from an OK or UP state to a problem state, a global problem ID number is incremented by one (1). This macro will be non-zero if the service is currently a non-OK state. State transitions between non-OK states (e.g. WARNING to CRITICAL) do not cause this problem id to increase. If the service is currently in an OK state, this macro will be set to zero (0). Combined with event handlers, this macro could be used to automatically open trouble tickets when services first enter a problem state. |
| $LASTSERVICEPROBLEMID$ | The previous (globally unique) problem number that was given to the service. Combined with event handlers, this macro could be used for automatically closing trouble tickets, etc. when a service recovers to an OK state. |
| $SERVICELATENCY$ | A (floating point) number indicating the number of seconds that a scheduled service check lagged behind its scheduled check time. For instance, if a check was scheduled for 03:14:15 and it didn't get executed until 03:14:17, there would be a check latency of 2.0 seconds. |
| $SERVICEEXECUTIONTIME$ | A (floating point) number indicating the number of seconds that the service check took to execute (i.e. the amount of time the check was executing). |
| $SERVICEDURATION$ | A string indicating the amount of time that the service has spent in its current state. Format is "XXh YYm ZZs", indicating hours, minutes and seconds. |
| $SERVICEDURATIONSEC$ | A number indicating the number of seconds that the service has spent in its current state. |
| $SERVICEDOWNTIME$ | A number indicating the current "downtime depth" for the service. If this service is currently in a period of scheduled downtime, the value will be greater than zero. If the service is not currently in a period of downtime, this value will be zero. |
| $SERVICEPERCENTCHANGE$ | A (floating point) number indicating the percent state change the service has undergone. Percent state change is used by the flap detection algorithm. |
| $SERVICEGROUPNAME$ | The short name of the servicegroup that this service belongs to. This value is taken from the servicegroup_name directive in the servicegroup definition. If the service belongs to more than one servicegroup this macro will contain the name of just one of them. |
| $SERVICEGROUPNAMES$ | A comma separated list of the short names of all the servicegroups that this service belongs to. |
| $LASTSERVICECHECK$ | This is a timestamp in time_t format (UNIX系统的秒计数器) indicating the time at which a check of the service was last performed. |
| $LASTSERVICESTATECHANGE$ | This is a timestamp in time_t format (UNIX系统的秒计数器) indicating the time the service last changed state. |
| $LASTSERVICEOK$ | This is a timestamp in time_t format (UNIX系统的秒计数器) indicating the time at which the service was last detected as being in an OK state. |
| $LASTSERVICEWARNING$ | This is a timestamp in time_t format (UNIX系统的秒计数器) indicating the time at which the service was last detected as being in a WARNING state. |
| $LASTSERVICEUNKNOWN$ | This is a timestamp in time_t format (UNIX系统的秒计数器) indicating the time at which the service was last detected as being in an UNKNOWN state. |
| $LASTSERVICECRITICAL$ | This is a timestamp in time_t format (UNIX系统的秒计数器) indicating the time at which the service was last detected as being in a CRITICAL state. |
| $SERVICEOUTPUT$ | The first line of text output from the last service check (i.e. "Ping OK"). |
| $LONGSERVICEOUTPUT$ | The full text output (aside from the first line) from the last service check. |
| $SERVICEPERFDATA$ | This macro contains any performance data that may have been returned by the last service check. |
| $SERVICECHECKCOMMAND$ | This macro contains the name of the command (along with any arguments passed to it) used to perform the service check. |
| $SERVICEACKAUTHOR$8 | A string containing the name of the user who acknowledged the service problem. This macro is only valid in notifications where the $NOTIFICATIONTYPE$ macro is set to "ACKNOWLEDGEMENT". |
| $SERVICEACKAUTHORNAME$8 | A string containing the short name of the contact (if applicable) who acknowledged the service problem. This macro is only valid in notifications where the $NOTIFICATIONTYPE$ macro is set to "ACKNOWLEDGEMENT". |
| $SERVICEACKAUTHORALIAS$8 | A string containing the alias of the contact (if applicable) who acknowledged the service problem. This macro is only valid in notifications where the $NOTIFICATIONTYPE$ macro is set to "ACKNOWLEDGEMENT". |
| $SERVICEACKCOMMENT$8 | A string containing the acknowledgement comment that was entered by the user who acknowledged the service problem. This macro is only valid in notifications where the $NOTIFICATIONTYPE$ macro is set to "ACKNOWLEDGEMENT". |
| $SERVICEACTIONURL$ | Action URL for the service. This macro may contain other macros (e.g. $HOSTNAME$ or $SERVICEDESC$), which can be useful when you want to pass the service name to a web page. |
| $SERVICENOTESURL$ | Notes URL for the service. This macro may contain other macros (e.g. $HOSTNAME$ or $SERVICEDESC$), which can be useful when you want to pass the service name to a web page. |
| $SERVICENOTES$ | Notes for the service. This macro may contain other macros (e.g. $HOSTNAME$ or $SERVICESTATE$), which can be useful when you want to service-specific status information, etc. in the description |
表 8.16. 服务组宏:6
| $SERVICEGROUPALIAS$6 | The long name / alias of either 1) the servicegroup name passed as an on-demand macro argument or 2) the primary servicegroup associated with the current service (if not used in the context of an on-demand macro). This value is taken from the alias directive in the servicegroup definition. |
| $SERVICEGROUPMEMBERS$6 | A comma-separated list of all services that belong to either 1) the servicegroup name passed as an on-demand macro argument or 2) the primary servicegroup associated with the current service (if not used in the context of an on-demand macro). |
| $SERVICEGROUPNOTES$6 | The notes associated with either 1) the servicegroup name passed as an on-demand macro argument or 2) the primary servicegroup associated with the current service (if not used in the context of an on-demand macro). This value is taken from the notes directive in the servicegroup definition. |
| $SERVICEGROUPNOTESURL$6 | The notes URL associated with either 1) the servicegroup name passed as an on-demand macro argument or 2) the primary servicegroup associated with the current service (if not used in the context of an on-demand macro). This value is taken from the notes_url directive in the servicegroup definition. |
| $SERVICEGROUPNOTES$6 | The action URL associated with either 1) the servicegroup name passed as an on-demand macro argument or 2) the primary servicegroup associated with the current service (if not used in the context of an on-demand macro). This value is taken from the action_url directive in the servicegroup definition. |
表 8.17. 联系人宏:
| $CONTACTNAME$ | Short name for the contact (i.e. "jdoe") that is being notified of a host or service problem. This value is taken from the contact_name directive in the contact definition. |
| $CONTACTALIAS$ | Long name/description for the contact (i.e. "John Doe") being notified. This value is taken from the alias directive in the contact definition. |
| $CONTACTEMAIL$ | Email address of the contact being notified. This value is taken from the email directive in the contact definition. |
| $CONTACTPAGER$ | Pager number/address of the contact being notified. This value is taken from the pager directive in the contact definition. |
| $CONTACTADDRESSn$ | Address of the contact being notified. Each contact can have six different addresses (in addition to email address and pager number). The macros for these addresses are $CONTACTADDRESS1$ - $CONTACTADDRESS6$. This value is taken from the addressx directive in the contact definition. |
| $CONTACTGROUPNAME$ | The short name of the contactgroup that this contact is a member of. This value is taken from the contactgroup_name directive in the contactgroup definition. If the contact belongs to more than one contactgroup this macro will contain the name of just one of them. |
| $CONTACTGROUPNAMES$ | A comma separated list of the short names of all the contactgroups that this contact is a member of. |
表 8.18. 联系人组宏:5
| $CONTACTGROUPALIAS$7 | The long name / alias of either 1) the contactgroup name passed as an on-demand macro argument or 2) the primary contactgroup associated with the current contact (if not used in the context of an on-demand macro). This value is taken from the alias directive in the contactgroup definition. |
| $CONTACTGROUPMEMBERS$7 | A comma-separated list of all contacts that belong to either 1) the contactgroup name passed as an on-demand macro argument or 2) the primary contactgroup associated with the current contact (if not used in the context of an on-demand macro). |
表 8.19. 汇总统计宏:
| $TOTALHOSTSUP$ | This macro reflects the total number of hosts that are currently in an UP state. |
| $TOTALHOSTSDOWN$ | This macro reflects the total number of hosts that are currently in a DOWN state. |
| $TOTALHOSTSUNREACHABLE$ | This macro reflects the total number of hosts that are currently in an UNREACHABLE state. |
| $TOTALHOSTSDOWNUNHANDLED$ | This macro reflects the total number of hosts that are currently in a DOWN state that are not currently being "handled". Unhandled host problems are those that are not acknowledged, are not currently in scheduled downtime, and for which checks are currently enabled. |
| $TOTALHOSTSUNREACHABLEUNHANDLED$ | This macro reflects the total number of hosts that are currently in an UNREACHABLE state that are not currently being "handled". Unhandled host problems are those that are not acknowledged, are not currently in scheduled downtime, and for which checks are currently enabled. |
| $TOTALHOSTPROBLEMS$ | This macro reflects the total number of hosts that are currently either in a DOWN or an UNREACHABLE state. |
| $TOTALHOSTPROBLEMSUNHANDLED$ | This macro reflects the total number of hosts that are currently either in a DOWN or an UNREACHABLE state that are not currently being "handled". Unhandled host problems are those that are not acknowledged, are not currently in scheduled downtime, and for which checks are currently enabled. |
| $TOTALSERVICESOK$ | This macro reflects the total number of services that are currently in an OK state. |
| $TOTALSERVICESWARNING$ | This macro reflects the total number of services that are currently in a WARNING state. |
| $TOTALSERVICESCRITICAL$ | This macro reflects the total number of services that are currently in a CRITICAL state. |
| $TOTALSERVICESUNKNOWN$ | This macro reflects the total number of services that are currently in an UNKNOWN state. |
| $TOTALSERVICESWARNINGUNHANDLED$ | This macro reflects the total number of services that are currently in a WARNING state that are not currently being "handled". Unhandled services problems are those that are not acknowledged, are not currently in scheduled downtime, and for which checks are currently enabled. |
| $TOTALSERVICESCRITICALUNHANDLED$ | This macro reflects the total number of services that are currently in a CRITICAL state that are not currently being "handled". Unhandled services problems are those that are not acknowledged, are not currently in scheduled downtime, and for which checks are currently enabled. |
| $TOTALSERVICESUNKNOWNUNHANDLED$ | This macro reflects the total number of services that are currently in an UNKNOWN state that are not currently being "handled". Unhandled services problems are those that are not acknowledged, are not currently in scheduled downtime, and for which checks are currently enabled. |
| $TOTALSERVICEPROBLEMS$ | This macro reflects the total number of services that are currently either in a WARNING, CRITICAL, or UNKNOWN state. |
| $TOTALSERVICEPROBLEMSUNHANDLED$ | This macro reflects the total number of services that are currently either in a WARNING, CRITICAL, or UNKNOWN state that are not currently being "handled". Unhandled services problems are those that are not acknowledged, are not currently in scheduled downtime, and for which checks are currently enabled. |
表 8.20. 通知宏:
表 8.21. 日期/时间宏:
| $LONGDATETIME$ | 当前的日期/时间戳(如Fri Oct 13 00:30:28 CDT 2000)。日期的格式符合date_format域设置。 |
| $SHORTDATETIME$ | 当前的日期/时间戳(如10-13-2000 00:30:28).。日期的格式符合date_format域设置。 |
| $DATE$ | 日期戳(如10-13-2000)。日期格式符合date_format域设置。 |
| $TIME$ | 当前时间戳(如00:30:28)。 |
| $TIMET$ | 以time_t格式表示的当前时间戳(UNIX系统的秒计数器)。 |
| $ISVALIDTIME:$9 | 这是按需宏所特有的,返回1或0,用以指示一个指定时刻在指定时间周期对象定义下是否合法。有两种方式来使用这个宏:
|
| $NEXTVALIDTIME:$9 | 这是按需宏所特有的,返回在指定的时间周期对象定义下的下一个合法的时间值(是time_t格式的),有两种方式来使用该宏:
|
表 8.22. 文件宏:
| $MAINCONFIGFILE$ | 主配置文件的保存位置。 |
| $STATUSDATAFILE$ | 状态数据文件的保存位置。 |
| $COMMENTDATAFILE$ | 注释数据文件的保存位置。 |
| $DOWNTIMEDATAFILE$ | 停机时间数据文件的保存位置。 |
| $RETENTIONDATAFILE$ | 状态保持数据文件的保存位置。 |
| $OBJECTCACHEFILE$ | 对象缓存文件的保存位置。 |
| $TEMPFILE$ | The location of the 临时文件的保存位置。 |
| $TEMPPATH$ | 临时目录变量所指向的目录。 |
| $LOGFILE$ | 日志文件的保存位置。 |
| $RESOURCEFILE$ | 资源文件的保存位置。 |
| $COMMANDFILE$ | 命令文件的保存位置。 |
| $HOSTPERFDATAFILE$ | (如果定义过的)主机性能数据文件的保存位置。 |
| $SERVICEPERFDATAFILE$ | (如果定义过的)服务性能数据文件的保存位置。 |
表 8.23. 其他宏:
| $PROCESSSTARTTIME$ | 以time_t(UNIX系统的秒计数器)格式的时间戳指向了Nagios进程启动或重启的时刻。可以用$TIMET$减去$PROCESSSTARTTIME$来计算出Nagios自最后一次启动至今共运行了多少秒。 |
| $EVENTSTARTTIME$ | 以time_t格式的时间戳,指示了Nagios开始处理事件(检测等)的时刻。可以用$EVENTSTARTTIME$减去$PROCESSSTARTTIME$来计算出Nagios花了多少秒来启动就绪。 |
| $ADMINEMAIL$ | 全局的管理员EMail地址,这个值是从配置文件里的admin_email域里取得的。 |
| $ADMINPAGER$ | 全局管理员的BP机号或地址,这个是从admin_pager域里取得的值。 |
| $ARGn$ | 指向第n个命令传递参数(通知、事件处理、服务检测等)。Nagios支持最多32个参数宏(从$ARG1$到$ARG32$)。 |
| $USERn$ | 指向第n个用户的宏。用户宏可以在资源文件里定义一个或多个。Nagios支持最多32个用户宏(从$USER1$到$USER32$)。 |
1当主机处于检测状态时与之相关的宏是无效的(如他们没有被检测也就还没有定性状态时);
2当服务处于检测状态时与之相关的宏是无效的(如他们没有被检测也就还没有定性状态时);
3当主机宏被用于服务相关命令时(如服务通知、事件处理等)主机宏被指向了与服务相关的主机;
4当主机与服务汇总统计宏被用于通知命令时,只是当联系人被授权的主机或服务被统计到汇总结果之中(如主机和服务配置以该联系人为通知接收人的情况);
5这些宏通常是指向当前主机所属的第一个(首要)主机组。很多情况下可被认为是一种主机宏。然而这些宏不能做为按需宏里的主机宏,当你用这些宏传主机组名时这些宏可被用做按需宏的主机组宏。如:$HOSTGROUPMEMBERS:hg1$将返回主机组hg1里的全部成员主机,是个以逗号分开的列表。
6这些宏通常是指向当前服务所属的第一个(首要)服务组。很多情况下可被认为是一种服务宏。然而这些宏不能做为按需宏里的服务宏,当你用这些宏传服务组名时这些宏可被用做按需宏的服务组宏。如:$SERVICEGROUPMEMBERS:sg1$将返回服务组sg1里的全部成员服务,是个以逗号分开的列表。
7这些宏通常是指向当前联系人所属的第一个(首要)联系人组。很多情况下可被认为是一种联系人宏。然而这些宏不能做为按需宏里的联系人宏,当你用这些宏传联系人名时这些宏可被用做按需宏的联系人宏。如:$CONTACTGROUPMEMBERS:cg1$将返回联系人组cg1里的全部成员联系人,是个以逗号分开的列表。
8尽量不使用这些宏。用更通用的宏$NOTIFICATIONAUTHOR$、$NOTIFICATIONAUTHORNAME$、$NOTIFICATIONAUTHORALIAS$或$NOTIFICATIONAUTHORCOMMENT$等宏替换。
9这些宏只用于按需宏 - 也就是说为了使用它们必须要提供额外的参数。这些宏在环境变量中不可用。
10汇总统计宏在当设置use_large_installation_tweaks选项使能时在环境变量中不可用,因为这将非常密集使用CPU来计算;
如果做过技术支持就会有过这种困惑,用户抱怨说“因特网不通了”而你却很抓狂。做为一个负责任的人,可以肯定的是没有人会拉掉网络供电电源,但是,由于用户在办公室上不了网却确实地存在。
如果是个技术性故障,可能会找寻故障问题所在。可能会重启动用户计算机,可能是用户的网线头没插好,也可能是核心路由器有点“抽风”。无论哪个问题,只有一个是肯定存在的 - 因特网不通。只是对那个用户而言因特网是不可达的。
Nagios具备判断所监控主机是否处于宕机还是不可达状态的能力。两个是很不同的状态(虽然它们是相关联的)并且可以帮助你快速地找到故障根源。下面是网络可达性逻辑如何来分辨两种状态的说明...
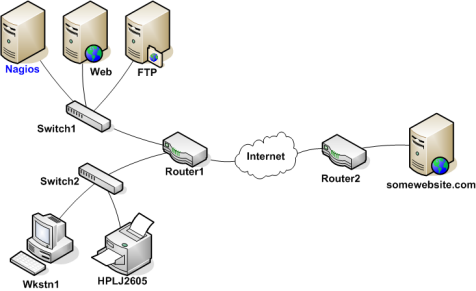
为使Nagios分辨出所监控主机所处于宕机还是不可达状态,必须要给出主机间的联接关系-联接关系要基于Nagios主守护程序所在点为根点。追踪每个从Nagios主守护程序到各自节点的数据包将可以得到这种关系。每个交换机、路由器和服务器上的数据包碰撞或通过都认为是网络拓扑中的一跳"hop",需要在Nagios里定义出主机间的父/子节点关系,下面给出例子中的网络在Nagios中的父/子关系视图:
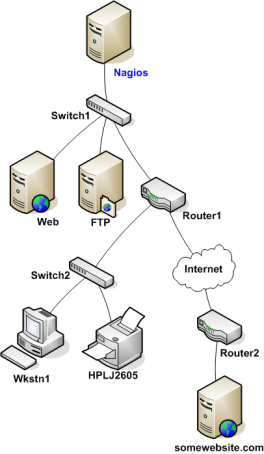
看图可以知道各个被监控主机的父/子节点关系了,但在Nagios的配置里如何来表达呢?可以用主机对象定义里面的parents域来实现。下面是例子中的对象定义的关于父/子节点关系的片段:
define host{
	host_name		Nagios   ; <-- The local host has no parent - it is the topmost host
	}
define host{
	host_name		Switch1
	parents		Nagios
	}
define host{
	host_name		Web
	parents		Switch1
	}
define host{
	host_name		FTP
	parents		Switch1
	}
define host{
	host_name		Router1
	parents		Switch1
	}
define host{
	host_name		Switch2
	parents		Router1
	}
define host{
	host_name		Wkstn1
	parents		Switch2
	}
define host{
	host_name		HPLJ2605
	parents		Switch2
	}
define host{
	host_name		Router2
	parents		Router1
	}
define host{
	host_name		somewebsite.com
	parents		Router2
	}
现在已经将主机的父/子逻辑关系正确地配置到了Nagios里,下面看一下当故障产生时会发生什么事。假定两个主机-Web与Router1-掉线了...
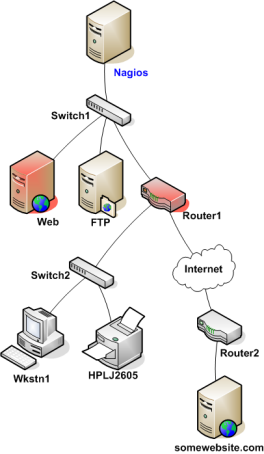
当主机状态改变(如从运行到宕机),Nagios唤起了网络可达性逻辑。可达性逻辑将初始化一个并发检测,只要是状态改变的主机的父/子节点都会被检测。在网络框架里变化发生时,这将使得Nagios迅速地对当前网络状态进行分析判定。
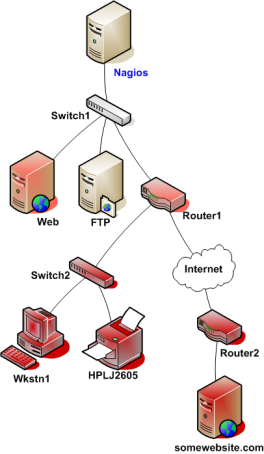
在本例中,Nagios将判定Web和Router1都处于宕机状态因为到达这两台主机的“路径”并没有阻塞。
Nagios将判定出在拓扑逻辑上Router1之下的所有主机处于不可达状态,因为Nagios无法找到它们。Router1的宕机将阻塞了到达这些主机的路径。这些主机可能运行得好着呢,也或是已经掉线-Nagios无法得知因为无法把测试包送达那里,因而Nagios认为那些主机是不可达而不是宕机。
Nagios具备分辨"通常服务"与"可变服务"的能力。在服务对象定义里的is_volatile域可以指定该服务是否是一个可变服务。很多情况下,绝大多数的被监控服务都不是"可变服务"(也就是"通常服务"),而可变服务可在几种情形下使用...
在每次处于硬态非正常状态情况下做检测而检测将返回一个非正常状态(如没有发生状态变换)的情况下,可变服务与通常服务将会有三个明显差异:
- 非正常服务状态被记录下来(产生日志);
- 服务故障将会送给联系人(如果该故障需要做通知的话)。注意:在可变服务对象的设置里的通知间隔将被忽略;
- 针对该服务的事件处理将会被执行(如果对象里定义过的话)。
当指定的服务处于非正常状态并且一个硬态状态变换刚刚发生的时候,以上操作才会发生。也就是说,只是该服务首次转入相同的非正常状态时才会做。如果之后的服务检测结果同样是非正常状态,没有硬态状态变换发生,那么就不会再有以上操作。
如果将可变服务与强制服务检测两个功能特性组合使用,可以实现很有用的功能。下面的例子中包括处理SNMP Trap告警、安全警报等。
给个例子...假定你运行了PortSentry(端口哨兵)来检测对你机器的端口扫描和防火墙的入侵企图。如果要Nagios来显示端口扫描,可以照下面的来做...
Nagios配置:
- 创建一个服务对象定义,命名为Port Scans并且与那个运行PortSentry的主机绑定在一起;
- 设定服务对象里的max_check_attempts域值为1。这将通知Nagios当一个非正常状态报告时服务状态将即刻转入硬态状态(不必再重试);
- 设定服务对象里的active_checks_enabled域值为0。这会阻止Nagios不必再启动针对服务的自主检测;
- 设定服务对象里的passive_checks_enabled域值为1。这将会启动针对该服务的强制检测;
- 设置服务对象里的is_volatile域值为1。
PortSentry配置:
编辑PortSentry配置文件(portsentry.conf)并且定义一个KILL_RUN_CMD命令,象这样:
KILL_RUN_CMD="/usr/local/Nagios/libexec/eventhandlers/submit_check_result host_name 'Port Scans' 2 'Port scan from host $TARGET$ on port $PORT$. Host has been firewalled.'"
要确保把里面的host_name替换为服务绑定的主机对象的短名称。
端口扫描脚本:
创建一个SHELL脚本,放在/usr/local/nagios/libexec/eventhandlers目录下并命名为submit_check_result。这个脚本的内容可能会是这样的...
#!/bin/sh
	# Write a command to the Nagios command file to cause
	# it to process a service check result
	echocmd="/bin/echo"
	CommandFile="/usr/local/nagios/var/rw/nagios.cmd"
	# get the current date/time in seconds since UNIX epoch
	datetime=`date +%s`
	# create the command line to add to the command file
	cmdline="[$datetime] PROCESS_SERVICE_CHECK_RESULT;$1;$2;$3;$4"
	# append the command to the end of the command file
	`$echocmd $cmdline >> $CommandFile`
那么当PortSentry检测到了一个针对机器的端口扫描时将会做些什么呢?
- PortSentry将会防护该主机(这是PortSentry软件的功能);
- PortSentry将执行submit_check_resultSHELL脚本并送给Nagios一个强制检测的结果;
- Nagios将从外部命令文件中读取并确认由PortSentry提交的内容;
- Nagios将把Port Scans服务状态置成"硬态紧急状态"并给联系人送出通知。
很棒吧?

Nagios有对主机和服务检测的结果做"刷新检测"的特性。刷新检测的目的是为保证由外部应用而做的主机与服务强制检测可以正常提供结果数据。
Nagios定期地刷新全部的打开检测功能的主机与服务检测状态。
- 由每个主机或服务计算出一个刷新门限;
- 对于每个主机与服务,最后一次检测结果的时间长短会与刷新门限相比对;
- 如果最后一次检测结果的时间大于刷新检测门限,检测结果会被认为是"陈旧"的;
- 如果检测结果被认为是"陈旧的",Nagios将强制地针对该主机或服务用主机与服务对象定义里指定的命令来执行一次自主检测。
提示
例如,如果一个服务的刷新门限设定为60秒,Nagios将认为如果最后一次检测结果如果存在时间超过60秒将会认为该结果是"陈旧"的。
如果要打开刷新检测需要做如下事情:
- 在程序层面使能刷新检测要用check_service_freshness和check_host_freshness域来控制;
- 用service_freshness_check_interval和host_freshness_check_interval选项来设置Nagios以何频度来刷新主机和服务检测结果;
- 在主机与服务对象定义里打开主机的和服务的刷新检测开关,是设置对象里的check_freshness选项值为1;
- 配置主机和服务对象定义里的刷新检测门限,即设置对象里的freshness_threshold选项;
- 配置主机与服务对象定义里的check_command选项指向一个合法的可被用于自主检测的命令,当发现结果"陈旧"时可以使用该命令;
- 在主机与服务对象定义里的check_period选项可用于当Nagios认为需要进行一次刷新时可用时间周期,因而要保证它是一个合法的时间周期(译者注-在需要自主检测时刻可落入该时间周期定义);
提示
下面是一个可能需要刷新检测的服务样例,它是每天夜间做备份作业的服务。可能已经有一个外部脚在作业完成时向Nagios提交备份作业的结果。在这种情形下,全部的针对该服务的检测与结果将是由强制检测的外部应用来完成的。为保证每天的备份作业的状态都会被Nagios所收集报告,需要打开针对该服务的刷新检测。如果外部对备份作业的脚本没有提交检测结果,可以让Nagios取得一个紧急处置结果,象这样...
下面是该服务定义的样本(有些东西被省略了)...
define service{
	host_name		backup-server
	service_description	ArcServe Backup Job
	active_checks_enabled	0		; active checks are NOT enabled
	passive_checks_enabled	1		; passive checks are enabled (this is how results are reported)
	check_freshness		1
	freshness_threshold	93600		; 26 hour threshold, since backups may not always finish at the same time
	check_command		no-backup-report	; this command is run only if the service results are "stale"
	...other options...
	}
应该注意,该服务的自主检测是关闭的,这是因为该服务的检测是由外部应用使用强制检测机制送达Nagios。刷新检测打开了而且刷新门限设置为26小时。这个设置略长于备份作业每天所需要的24小时,因为备份作业每天时间长短不同(它是由多少数据量要做备份和当时的网络拥塞等等情况所决定)。设定的no-backup-report命令只是当服务检测结果被认为是"陈旧"的时候才执行的,这个no-backup-report命令的定义看起来象是这样:
define command{
	command_name	no-backup-report
	command_line	/usr/local/nagios/libexec/nobackupreport.sh
	}
这个nobackupreport.sh脚本放在/usr/local/nagios/libexec目录里,内容可能是这样的:
#!/bin/sh
/bin/echo "CRITICAL: Results of backup job were not reported!"
exit 2
如果Nagios检测到服务结果是"陈旧"的,它会以自主检测的方式来运行no-backup-report命令,也就是执行/usr/local/nagios/libexec/nobackupreport.sh脚本,它将给Nagios返回一个紧急状态。那么这个备份作业的服务就将处于紧急状态(如果它还不是紧急状态的话)同时相关人员可能会收到一个故障通知。
Nagios支持可选的发现主机与服务抖动的功能。当服务与主机状态改变过于频繁时会产生抖动,其结果产生了故障与恢复的通知风暴。抖动可能是由于配置的问题(如门限过低)、有毛病的服务或是真实的网络问题。
在此之前,我想说的是抖动的感知有点难实现。如何精确地确定网络与主机的什么叫做“过分频繁”?当我第一次考虑对感知抖动的实现时,我试图找到发现抖动本该或应该或是如何做的信息,但是一无所获,所以决定用一种对我言是一种合理的方式来解决它...
每当Nagios对主机与服务进行检测,它将查看该主机或服务是否已开始或停止抖动,条件有几条:
- 保存好的对主机与服务的检测结果至少21个;
- 分析历史检测结果确定状态变换发生了;
- 用状态转换判定主机与服务状态值改变的百分比;
- 比较这个百分比是否越过了设定的抖动门限的最低值与最高值;
认定主机与服务的抖动开始是它的状态改变率首次高于抖动门限的高限。
认定主机与服务的抖动结束是它的状态改变率低于抖动门限低限(前提是它已经处于抖动状态)。
下面用个服务来更详细地说明如何感知抖动的...
下图给出了最近21次检测结果的按时序的历史状态。正常(OK)态标记为绿色,告警(WARNING)态为黄色,紧急(CRITICAL)为红色,未知(UNKOWN)态为橙色。
对历史检测结果的检查决定了哪个时间里有状态变换发生,状态变换发生于存档状态与其前一次状态不同的时刻。由于用数组保存了最近21次检测结果,因而可以知道最多可能会产生20次变化。在本例中有7次状态变化,在图中上方用蓝色箭头示意出来。
感知状态抖动逻辑使用状态变换来判定整体服务的状态变化率,用于度量服务变化或更改的频度。没有发生过状态变化的变化率为0%,而每次都变化的状态变化率是100%。服务的状态变化应该在此之间变化。
当计算服务的状态变化率时,感知抖动的算法将会给对近期变化更多权重,旧的变化权重低。特别地,将近期变化给出50%的权重。图中示出对指定服务使用了近期变化有更多权重来计算整体变化率的情况。
利用图示结果,计算一下服务的状态变化率。共有7次状态变化(分别位于t3、t4、t5、t9、t12、t16和t19)。没有任何状态变化权重时结果将会是35%:
(7次查出的状态变化/20次最大状态变化次数)*100%=35%
因为感知抖动的检测逻辑使用近期变化更大的权重,所以该例中实际计算时变化率会低于35%。假定这个加权后的变化率是31%...
使用计算后的服务的状态变化率(31%)来比对抖动门限将会发生:
- 如果先前没有发生抖动且31%等于或超出了抖动门限的高限,Nagios将判定服务开始抖动;
- 如果服务先前处于抖动而且31%低于抖动门限的低限,Nagios将判定服务停止抖动;
如果两个都没有发生,感知抖动逻辑将不会对服务做任何动作,因为它既没有变为抖动也或许正在抖动。
主机的抖动感知与服务的相似,只是一个重要的不同:Nagios将在如下情形时尝试对其进行抖动中的检测:
- 主机检测时(自主检测或强制检测时都会做)
- 有时与主机绑定的服务被检测时。更特殊地,当至少x次的抖动感知做过时,此处的x等于全部与主机绑定服务的平均检测间隔时间。
为何要这样?由于最少的两次抖动检查次数间的时间最少是等于服务检测间隔时间。然而可能对主机的监控并非基于规格化的间隔,所以对主机的抖动检测可能对它的抖动感知的检查不是主机检测的间隔时间。同样地,要知道对服务的检查会叠加到主机的抖动感知检测上。毕竟服务是主机上的属性而不是别的...在种种检查速率相比之下,这个是最好的方式来多次地对主机进行抖动检查,所以你也得如此。
Nagios在抖动感知逻辑中用若干个值来判定状态变化率。既有主机的也有服务的,配置里面有全局的门限高限和低限也有专门针对主机的或是服务的门限。Nagios将在没有指定专门主机的或服务的门限时使用全局的门限值。
下表给出了全局的、专给主机的和专给服务的的门限值的控制变量。
通常Nagios将记录下针对主机和服务的最后21次检测结果用于抖动感知逻辑,而不管全部的检查结果。
提示
当服务或主机首次发现处于抖动时,Nagios将会:
- 记录下服务与主机正在抖动的信息;
- 给主机与服务增加一个非持续性的注释以说明它正在抖动;
- 给服务与主机相关的联系人发送一个"开始抖动"的通知;
- 压制主机与服务的其他通知(这个在通知逻辑中有一个过滤);
当服务或主机停止抖动时,Nagios将会:
- 记录下主机与服务停止了抖动;
- 删除最初的给主机与服务增加的开始抖动的注释;
- 给主机与服务相关的联系人送出一个"抖动停止"的通知;
- 停止阻塞该主机与服务的通知(通知转回到正常的通知逻辑)。
在Nagios打开抖动感知功能,需要如下设置:
- 将enable_flap_detection域设置为1;
- 在主机与服务对象定义中的flap_detection_enabled域设置为1;
如果想关闭全局的抖动感知功能,将enable_flap_detection域设置为0;
如果只想关闭一部分主机与服务的抖动检查,使用在主机与服务对象定义里flap_detection_enabled域来控制它;

Nagios支持对主机与服务所对应联系人通知的对象扩展。主机与服务中有关通知的对象扩展是由对象定义文件里的主机扩展对象和服务扩展对象来声明的。
注意

通知扩展将会且仅会在一个或多个扩展对象与当前要送出的通知相匹配时才做。如果主机与服务的通知与对象扩展不匹配任何一个合法的对象扩展,不会有主机或服务的对象扩展被应用于当前的通知过程中。见下面的例子:
define serviceescalation{
	host_name		webserver
	service_description	HTTP
	first_notification	3
	last_notification	5
	notification_interval	90
	contact_groups		nt-admins,managers
}
define serviceescalation{
	host_name		webserver
	service_description	HTTP
	first_notification	6
	last_notification	10
	notification_interval	60
	contact_groups		nt-admins,managers,everyone
}
要注意有一个通知的对象扩展定义的“孔洞”(空白区间)。也就是第1与第2个通知不会被扩展对象处理,对于超出10的通知也不会处理。对于第1和第2次通知,与全部的通知一样将使用服务对象里的默认联系人组里的联系人做对象通知。在例子中,假定服务对象定义里的默认的联系人组是名为nt-admins的联系人组。
当定义了通知相关的对象扩展,很重要的一点是要记得“低级别”对象扩展里的联系人组一定要出现在“高级别”对象扩展里的联系人组。这样才会确保每一个将要收到故障通知的人在故障不断扩张的情况下会持续地收到通知。例如:
define serviceescalation{
	host_name		webserver
	service_description	HTTP
	first_notification	3
	last_notification	5
	notification_interval	90
	contact_groups		nt-admins,managers
}
define serviceescalation{
	host_name		webserver
	service_description	HTTP
	first_notification	6
	last_notification	0
	notification_interval	60
	contact_groups		nt-admins,managers,everyone
}
第一个("低级别")档次的扩展包括了nt-admins和managers两个联系人组。后一个("高级别")档次的扩展包括了nt-admins、managers和everyone等三个联系人组。注意,nt-admins这个联系人组被包含在两个档次的扩展里,这样做可以使这个联系人组的成员可以在前两个通知送达后仍旧可以接到后序的通知。managers联系人组最初是在第一个档次("低级别")的扩展里出现-里面的成员会在第三个通知开始送出时收到通知。肯定是希望managers组里的联系人可持续地收到之后的通知(如果第5次故障通知还在的话),因而这个组也加到了第2("高级别")档次的扩展定义里了。
关于通知的对象扩展可以被覆盖,见下面的例子:
define serviceescalation{
	host_name		webserver
	service_description	HTTP
	first_notification	3
	last_notification	5
	notification_interval	20
	contact_groups		nt-admins,managers
}
define serviceescalation{
	host_name		webserver
	service_description	HTTP
	first_notification	4
	last_notification	0
	notification_interval	30
	contact_groups		on-call-support
}
在上例中,
- nt-admins和managers两个联系人组将在第3次通知开始时收到通知;
- 全部的三个联系人组将在第4和第5次通知时收到通知;
- 仅仅是on-call-support联系人组会在第6次及之后的通知送出时收到通知。
当通知被扩展的时候,恢复通知会因故障通知状态不同而稍有不同,见下例:
define serviceescalation{
	host_name		webserver
	service_description	HTTP
	first_notification	3
	last_notification	5
	notification_interval	20
	contact_groups		nt-admins,managers
}
define serviceescalation{
	host_name		webserver
	service_description	HTTP
	first_notification	4
	last_notification	0
	notification_interval	30
	contact_groups		on-call-support
}
如果在第3次故障通知之后服务检测后要送出一个恢复通知,那么谁会收到通知?事实上,这个恢复通知应该算是第4个通知,然而Nagios的通知扩展代码会“聪明地判断出”其实只有收到第3次通知的联系人组才应该收到这个恢复通知。这时,nt-admins和managers联系人组将收到这个恢复通知。(译者注:那个on-call-support组里的联系人不会收到!)
还可以修改对指定主机与服务通知的送出频度,用主机扩展与服务扩展对象定义里的notification_interval域来指定不同的频度。如下例:
define serviceescalation{
	host_name		webserver
	service_description	HTTP
	first_notification	3
	last_notification	5
	notification_interval	45
	contact_groups		nt-admins,managers
}
define serviceescalation{
	host_name		webserver
	service_description	HTTP
	first_notification	6
	last_notification	0
	notification_interval	60
	contact_groups		nt-admins,managers,everyone
}
这个例子中,这个服务的默认通知送出间隔是240分钟(该值是在服务对象定义里设置的)。当该服务的通知被扩展到第3、第4和第5次时,每次通知的间隔将是45分钟。在第6次及之后,通知间隔将变成60分钟,这个是在第2个的服务扩展对象里定义的。
既然主机与服务的对象扩展有可能覆盖,而且某个主机事实上有可能从属于多个主机组,那么Nagios就不得不就在通知间隔有覆盖的情况下取哪个通知间隔做个决定。当对于一个服务通知存在有多个合法有效的对象扩展定义时,Nagios将会取其中最小的通知间隔来做为间隔。见下例:
define serviceescalation{
	host_name		webserver
	service_description	HTTP
	first_notification	3
	last_notification	5
	notification_interval	45
	contact_groups		nt-admins,managers
}
define serviceescalation{
	host_name		webserver
	service_description	HTTP
	first_notification	4
	last_notification	0
	notification_interval	60
	contact_groups		nt-admins,managers,everyone
}
该例中有针对第4和第5次通知,有两个对象扩展相互覆盖。这两次通知间隔里,Nagios的通知间隔将是45分钟,因为当这几次通知要送出时在现有的合法有效的服务对象扩展里这个值最小。
define serviceescalation{
	host_name		webserver
	service_description	HTTP
	first_notification	3
	last_notification	5
	notification_interval	45
	contact_groups		nt-admins,managers
}
define serviceescalation{
	host_name		webserver
	service_description	HTTP
	first_notification	4
	last_notification	6
	notification_interval	0
	contact_groups		nt-admins,managers,everyone
}
define serviceescalation{
	host_name		webserver
	service_description	HTTP
	first_notification	7
	last_notification	0
	notification_interval	30
	contact_groups		nt-admins,managers
}
在上例中,故障通知的最大次数是在4。这是因为第二档次的服务对象扩展里的通知间隔值是0,因而(当第4次通知将要被送出时)只会送出一个通知而之后通知被抑制。因此,在第4次通知送出后第三个服务扩展对象无论如何也不会起作用了。
通常的情况下,对通知的对象扩展可以用于任意想要送出主机与服务通知的时刻。这个"通知时间窗口"取决于主机与服务对象定义里的notification_period域值。
可以用主机扩展与对象扩展里的escalation_period域来指定一个特定时间周期使得扩展被限定只处于某个特定时间段内。使用escalation_period域来指定某个时间周期里对象扩展是可用的,对象扩展将只是在指定的时间里可用。如果没有在escalation_period域里指定时间周期,主机扩展与服务扩展将会在"通知时间窗口"内的任意时间里是可用的。
注意
(原文档题目使用的是On-Call,有"随叫随到、应召"的意思,所以翻译为"应召"--译者注)

管理员通常要承担着响应PB机呼叫、电话等工作,即使他们不情愿。没人喜欢在清晨四点被叫起处理问题,但午夜修正错误会肯定会好些,总比在早上九点闲庭信步的时候碰到一脸怒气的老板要强许多吧。
应召循环设定好后给那些承担起应急响应的一小搓倒霉蛋。通常在周未、晚间和假日里,有多个管理员轮流值守。
下面会以更容易地完成应召循环的方式来创建时间周期对象定义,这些定义无法处理人为因素(如管理员生病、换岗或是手机没电等),但可以建立一个基础计划框架在大部分时间里它肯定是适用的。
John和Bob是两个管理员负责对Nagios报警做出响应。John每周工作时间段内(不包括假日)负责接收全部通知,由Bob负责在每周未和假日里接收通知,Bob是那个幸运的倒霉蛋。下面给出如何定义时间周期对象定义...
首先,定义一个假日的时间周期对象:
define timeperiod{
	name	holidays
	timeperiod_name	holidays
	january 1			00:00-24:00	; New Year's Day
	2007-03-23		00:00-24:00	; Easter (2008)
	2007-04-12		00:00-24:00	; Easter (2009)
	monday -1 may		00:00-24:00	; Memorial Day (Last Monday in May)
	july 4			00:00-24:00	; Independence Day
	monday 1 september		00:00-24:00	; Labor Day (1st Monday in September)
	thursday 4 november	00:00-24:00	; Thanksgiving (4th Thursday in November)
	december 25		00:00-24:00	; Christmas
	december 31		17:00-24:00	; New Year's Eve (5pm onwards)
	}
下一步,给John定义一个应召时间周期对象,是平时每周的早晚工作时间,但不包括假日时间段:
define timeperiod{
	timeperiod_name		john-oncall
	monday		00:00-24:00
	tuesday		00:00-24:00
	wednesday		00:00-24:00
	thursday		00:00-24:00
	friday		00:00-24:00
	exclude		holidays		; Exclude holiday dates/times defined elsewhere
	}
下面可以在John的联系人定义里引用这个时间周期定义:
define contact{
	contact_name		john
	...
	host_notification_period		john-oncall
	service_notification_period		john-oncall
	}
给Bob定义一个应召时间段,包括每个周未和假日:
define timeperiod{
	timeperiod_name		bob-oncall
	friday		00:00-24:00
	saturday		00:00-24:00
	use		holidays	; Also include holiday date/times defined elsewhere
	}
在Bob的联系人定义里引用这个时间周期定义:
define contact{
	contact_name		bob
	...
	host_notification_period		bob-oncall
	service_notification_period		bob-oncall
	}
在该场景里John和Bob轮换地交接值班,不管这一天是周未、工作日还是假日。
定义一个时间周期对象,在该时间内由John负责接收通知,隔天工作。假定开始这天是2007年8月1日的全天,这个对象定义是:
define timeperiod{
	timeperiod_name		john-oncall
	2007-08-01 / 2	00:00-24:00	; Every two days, starting August 1st, 2007
	}
定义一个时间周期该由Bob负责接收通知,Bob接收通知的时候John不工作,所以他起始时间是2007年8月2日开始。
define timeperiod{
	timeperiod_name		bob-oncall
	2007-08-02 / 2	00:00-24:00	; Every two days, starting August 2nd, 2007
	}
下面可以在John和Bob的联系人对象定义里引用这两个时间周期定义:
define contact{
	contact_name		john
	...
	host_notification_period		john-oncall
	service_notification_period		john-oncall
	}
define contact{
	contact_name		bob
	...
	host_notification_period		bob-oncall
	service_notification_period		bob-oncall
	}
在这个场景里,由John和Bob每周一个地轮换周值班。由John负责干一周,Bob再干一周,周而复始。
定义John需要接收通知的时间周期对象,假定开始这一天是2007年7月29日开始的一周,定义如下:
define timeperiod{
	timeperiod_name		john-oncall
	2007-07-29 / 14	00:00-24:00	; Every 14 days (two weeks), starting Sunday, July 29th, 2007
	2007-07-30 / 14	00:00-24:00	; Every other Monday starting July 30th, 2007
	2007-07-31 / 14	00:00-24:00	; Every other Tuesday starting July 31st, 2007
	2007-08-01 / 14	00:00-24:00	; Every other Wednesday starting August 1st, 2007
	2007-08-02 / 14	00:00-24:00	; Every other Thursday starting August 2nd, 2007
	2007-08-03 / 14	00:00-24:00	; Every other Friday starting August 3rd, 2007
	2007-08-04 / 14	00:00-24:00	; Every other Saturday starting August 4th, 2007
	}
给Bob的工作时间定义一个时间周期对象定义。Bob是在John干完后的一周开始做应召值班,因而开始时间是2007年8月5日。
define timeperiod{
	timeperiod_name		bob-oncall
	2007-08-05 / 14	00:00-24:00	; Every 14 days (two weeks), starting Sunday, August 5th, 2007
	2007-08-06 / 14	00:00-24:00	; Every other Monday starting August 6th, 2007
	2007-08-07 / 14	00:00-24:00	; Every other Tuesday starting August 7th, 2007
	2007-08-08 / 14	00:00-24:00	; Every other Wednesday starting August 8th, 2007
	2007-08-09 / 14	00:00-24:00	; Every other Thursday starting August 9th, 2007
	2007-08-10 / 14	00:00-24:00	; Every other Friday starting August 10th, 2007
	2007-08-11 / 14	00:00-24:00	; Every other Saturday starting August 11th, 2007
	}
现在可以在John和Bob的联系人对象定义里引用这两个时间周期定义了:
define contact{
	contact_name		john
	...
	host_notification_period		john-oncall
	service_notification_period		john-oncall
	}
define contact{
	contact_name		bob
	...
	host_notification_period		bob-oncall
	service_notification_period		bob-oncall
	}
在该场景里,John在全部时间内处理报警,除非他休假。每个月他会固定休假同时还有一个长假,在John休假时由Bob来负责处理报警。
先给John定义一个休假和长假的时间段:
define timeperiod{
	name	john-out-of-office
	timeperiod_name	john-out-of-office
	day 15			00:00-24:00		; 15th day of each month
	day -1			00:00-24:00		; Last day of each month (28th, 29th, 30th, or 31st)
	day -2			00:00-24:00		; 2nd to last day of each month (27th, 28th, 29th, or 30th)
	january 2			00:00-24:00		; January 2nd each year
	june 1 - july 5		00:00-24:00		; Yearly camping trip (June 1st - July 5th)
	2007-11-01 - 2007-11-10	00:00-24:00		; Vacation to the US Virgin Islands (November 1st-10th, 2007)
	}
再定义出John的日常的应召时间安排,不包括上面的John的假日:
define timeperiod{
	timeperiod_name		john-oncall
	monday		00:00-24:00
	tuesday		00:00-24:00
	wednesday		00:00-24:00
	thursday		00:00-24:00
	friday		00:00-24:00
	exclude		john-out-of-office		; Exclude dates/times John is out
	}
下面可以在John的联系人对象里引用这个时间周期定义:
define contact{
	contact_name		john
	...
	host_notification_period		john-oncall
	service_notification_period		john-oncall
	}
再给Bob定义一个时间段,内容是John的休假日:
define timeperiod{
	timeperod_name		bob-oncall
	use		john-out-of-office	; Include holiday date/times that John is out
	}
下面就可以在Bob的联系人对象里引用这个时间周期定义:
define contact{
	contact_name		bob
	...
	host_notification_period		bob-oncall
	service_notification_period		bob-oncall
	}
可能会有各种各样的其他应召工作场景。在时间周期对象定义的日期例外项将可以处理几乎全部的日期相关或日期段相关的工作时间定义,请审视一下可用的不同时间格式。如果创建的时间段定义有错误,其结果是某个人总会是不能在指定时间内工作的。:-)
服务依赖的几个基本点:
- 服务可以依赖于一个或多个其他服务;
- 服务可以依赖于绑定于不同主机上的服务;
- 服务依赖是不被继承的(除非专门配置过);
- 服务领事可被用于在不同的状态情况(正常、告警、未知和紧急)下引发服务检测的执行和服务通知的抑制;
- 服务依赖可能只是在指定时间周期内合法。
首先做为基础。应在对象配置文件里创建服务依赖对象定义。每个服务依赖定义要指定依赖于哪个服务, 作为被依赖的服务的选取标准是当其失效时会引发执行与通知动作(下面会解释)。
可以给一个服务创建多个服务依赖,但必须要给每个依赖创建各自独立的依赖依赖对象。
下图中给出一个服务通知与执行依赖的逻辑示意,不同服务依赖于其他服务的通知和检测执行。
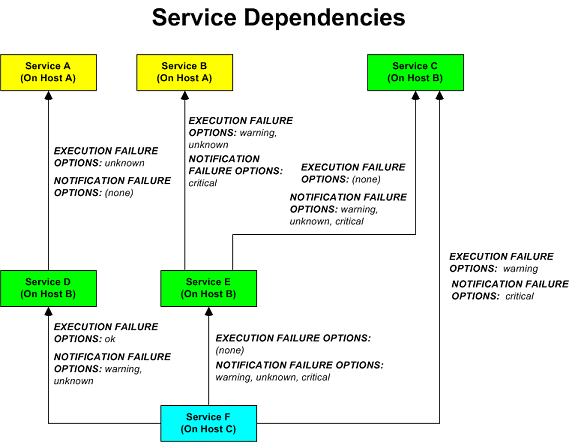
在这个例子中,在Host C主机上的Service F的服务依赖将被定义成这样:
define servicedependency{
	host_name			Host B
	service_description		Service D
	dependent_host_name		Host C
	dependent_service_description	Service F
	execution_failure_criteria	o
	notification_failure_criteria	w,u
}
define servicedependency{
	host_name			Host B
	service_description		Service E
	dependent_host_name		Host C
	dependent_service_description	Service F
	execution_failure_criteria	n
	notification_failure_criteria	w,u,c
}
define servicedependency{
	host_name			Host B
	service_description		Service C
	dependent_host_name		Host C
	dependent_service_description	Service F
	execution_failure_criteria	w
	notification_failure_criteria	c
}
在图中的其他服务依赖将被定义成这样:
define servicedependency{
	host_name			Host A
	service_description		Service A
	dependent_host_name		Host B
	dependent_service_description	Service D
	execution_failure_criteria	u
	notification_failure_criteria	n
}
define servicedependency{
	host_name			Host A
	service_description		Service B
	dependent_host_name		Host B
	dependent_service_description	Service E
	execution_failure_criteria	w,u
	notification_failure_criteria	c
}
define servicedependency{
	host_name			Host B
	service_description		Service C
	dependent_host_name		Host B
	dependent_service_description	Service E
	execution_failure_criteria	n
	notification_failure_criteria	w,u,c
}
在Nagios进行一个服务的检测或是送出该服务的通知之前,将会查看该服务是否有服务依赖。如果没有,那么象正常情况一样做做检测或送出服务通知。如果该服务存在一个或多个服务依赖,Nagios将会如下方式来检查每个服务依赖:
- Nagios将取出给定的当前*服务依赖的服务状况;
- Nagios用当前有服务依赖的服务状态去比对依赖对象定义(里面有关时间的设置)里所给出的执行或通知失效的选项;
- 如果当前有服务依赖的服务状态匹配中其中一个失效选项,依赖就失效并会中断依赖检测的逻辑循环;
- 如果当前有服务依赖的服务状态没有匹配中任何一个失效选项,依赖检查通过并且Nagios将继续运行并检查下一个依赖入口;
这个检测循环会继续直到全部的服务依赖都检查完成或是其中一个服务依赖的失效选项被命中。
注意
注:*重要的是,默认情况下,Nagios在进行依赖检查时将会使用该服务的最近的硬态状态所匹配的服务依赖。如果想让Nagios使用最近的状态(不管是软态状态还是硬态状态)来做服务的依赖匹配,需要使能soft_state_dependencies选项。当服务的主动检测将要被执行时可以用实施服务依赖来限制它,强制检测并不会被实施服务依赖所限制。
如果针对该服务依赖的全部测试都通过,Nagios将会象一般情况一样来执行针对该服务的检测。如果即使只有一个针对该服务依赖的测试没有通过,Nagios也将临时阻止针对该服务的检测,而在之后可能会通过针对该服务依赖的全部测试。如果是这样的话,Nagios将会再次来执行针对该服务的检测。更多的关有计划检测逻辑信息可以查阅这篇文档。
在上例中,服务E将在服务依赖检测中因为服务B处于告警或未知状态时测试失败。如果是这样的话,服务E的检测将不会执行而在此之后到计划检测时将可能再做。
如果针对该服务的全部通知依赖检测都通过,Nagios将会象一般情况一样送出该服务的通知。如果即便只有一个针对该服务的通知依赖没有通过测试,Nagios也将临时阻止送出针对该服务的通知,而之后可能会有针对该服务的通知依赖检测全部通过。如果是这样的话,Nagios将再次执行针对该服务的检测,更多的有关通知逻辑信息可以查阅这篇文档。
在上例中,服务F将在通知依赖检测中因服务C处于紧急状态而测试失败,也可能因服务D处于告警或未知状态,也可能因服务E处于告警或未知或紧急状态,也会使测试失败。如果是这样的话,将不会送出针对该服务的通知。
前面已经讲过,服务依赖关系默认是不会被继承的。在例子中,可以看到服务F依赖于服务E,然而,它并不会从服务E的依赖定义里继承对服务B和服务C的依赖关系。为使服务F依赖于服务C必须加入另一个服务依赖对象定义,而因为没有对服务B的依赖关系定义,因而服务F是不会依赖于服务B的。
如果真的希望让服务依赖关系继承,必须用服务依赖关系对象定义里的inherits_parent域来标识说明。当这个域使能时,说明该服务依赖继承了来自指向源服务的服务依赖关系(就是父节点服务依赖于什么服务它也一样要依赖于那些服务),也就是说如果源服务依赖的服务有一个依赖关系的检测失败的话,这个服务依赖的检测也会失败。
在上例中,设想一下,如果要加入一个针对服务F的新服务依赖关系定义使之依赖于服务A,可以给服务F创建一个新的服务依赖关系使之依赖于服务A,并让服务A做服务依赖源(也就是这个服务状态决定其后服务)。还也可以修改针对服务D与服务F的服务依赖对象定义,象这样:
define servicedependency{
	host_name			Host B
	service_description		Service D
	dependent_host_name		Host C
	dependent_service_description	Service F
	execution_failure_criteria	o
	notification_failure_criteria	n
	inherits_parent		1
}
因为inherits_parent域使能了,那么当测试服务F对服务D的依赖时也会对服务D与服务A的之间的依赖情况进行测试。
依赖关系可以在多种层次上继承,如果服务D与服务A之间的服务依赖关系对象定义里的inherits_parent域也使能(设置为1)时,并且服务A依赖于某个其他服务(比如说是服务G),那么服务F依赖于服务D、服务A和服务G(但每层依赖关系的要求是不一样的)。
正如期待的那样,主机的依赖关系也跟服务依赖关系一样的方式实现,只是针对的是主机间的关系而不服务间的关系。
提示
这有几个有关主机依赖的基本概念:
- 一个主机可以依赖于一个或多个其他主机;
- 主机依赖关系默认是不被继承的(除非专门配置声明);
- 主机依赖关系可被用于在不同状态环境(运行、宕机或不可达等)时抑制主机检测和主机通知;
- 主机依赖关系只是在设定的时间周期区间段内是合法有效的。
下图示意了一个主机通知依赖关系的逻辑拓扑。在通知时不同的主机依赖于其他的主机。

在上图例子中,针对主机C的依赖关系定义将会是这样的:
define hostdependency{
	host_name			Host A
	dependent_host_name		Host C
	notification_failure_criteria	d
}
define hostdependency{
	host_name			Host B
	dependent_host_name		Host C
	notification_failure_criteria	d,u
}
象服务依赖关系定义一样,主机依赖不会继承。在上图中,主机C并没有继承来自主机B的主机依赖关系。为使主机C也依赖于主机A,必须给它创建一个新的主机依赖关系定义。
主机通知的依赖关系处理机制与服务通知的依赖关系处理机制相似。如果对该主机的全部通知依赖关系的测试都通过的话,Nagios将象一般情况那样送出该主机的通知。如果即便是有一个该主机的通知依赖关系没有测试通过,Nagios也将会临时阻止针对该主机的通知送出。在此之后可能针对该主机的通知依赖关系全部通过,如果这种情况发生,Nagios将会象一般情况那样再送出该主机的通知。更多关有通知逻辑的信息可以查阅这篇文档。
主机和服务的依赖关系(从属关系、上下级关系)的定义可令你在执行检测时和在进行告警送出时拥有更大的控制力。一旦在监控过程中运用了关系定义,非常重要的是确保在依赖关系逻辑之上的状态信息保持同步,越新越好。
在它决定是否要送出报警或是允许对主机或服务进行自主检测时,Nagios允许你在进行针对主机和服务的依赖检测前做些准备以确认依赖逻辑将是最新的状态信息。
下图示意了一个被Nagios监控的主机组图,包含它们的父子节点关系及依赖关系定义。
图例中的Switch2主机刚好从运行状态到出问题的状态。Nagios需要判断主机是否是宕机或是不可达,因而它会运行并行检测针对Switch2的直接父节点(Firewall1)和子节点(Comp1、Comp2和Switch3)。这个是主机可达性检查函数的一般逻辑。
你或许注意到了Switch2是依赖于Monitor1和File1以进行告警和执行检测(这点在本例中并不重要)。如果主机依赖检测准备使能的话,Nagios将会在针对Switch2的直接父节检测的同时针对Monitor1和File1进行并行检测。Nagios这样做是因为很快就必须进行的依赖逻辑检查(例如需要告警)并且将要确保在依赖关系逻辑之中的与主机关系的部分的信息是最新的。
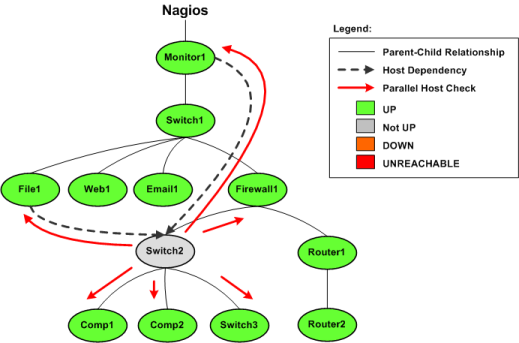
这就是进行的依赖检测前准备工作,很简单,不是么?
注意
服务依赖检测前的准备工作与之类似,只不过是把针对主机替换成针对服务。
依赖检测的准备涉及上面很少的部分,所以我推荐你打开这个功能。在许多情况下,拥有在依赖逻辑上的准确状态信息比过多地进行检测更具意义。
使能依赖检测准备很简单:
- 针对主机的依赖检测准备由enable_predictive_host_dependency_checks选项控制。
- 针对服务的依赖检测准备由enable_predictive_service_dependency_checks选项控制。
Nagios设计成可以处理插件检测返回状态数据的同时可选地做性能数据处理,也就是说,可由外部应用来处理性能数据。下面说明一下不同性能数据类型以及这些信息是如何被处理的...
在Nagios里可以有两大类性能数据:
- 检测过程的性能数据
- 插件返回的性能数据
检测过程的性能数据是与主机检测和服务检测相关的系统内部数据。这些数据包括象服务检测延时(就是检测实际检测的时刻与其计划时间之间的推后时间)和主机检测与服务检测执行所花费的时间。这类性能数据对全部可执行的检测都适用。$HOSTEXECUTIONTIME$和$SERVICEEXECUTIONTIME$宏定义可用于度量主机或服务检测所运行的时间,$HOSTLATENCY$和$SERVICELATENCY$宏定义可用于度量主机和服务检测的执行延时。
插件返回的性能数据是由主机与服务检测时插件检测结果带出来的外部数据。特定插件的数据,象丢包率、磁盘空闲空间、处理器负荷、当前登录的用户数等,是在执行时由插件自已来测量出来的任何一种类型数据。特定插件数据是可选项并非每个插件都有。(如果有)特定插件数据将包含在$HOSTPERFDATA$和$SERVICEPERFDATA$宏定义里。更多有关如何在Nagios里返回性能数据蕴涵在$HOSTPERFDATA$和$SERVICEPERFDATA$宏里面。
最小情况时,Nagios插件须用一行可读字符串来带出状态和相关测试值。例如,check_ping插件可以返回象这样的一行内容:
PING ok - Packet loss = 0%, RTA = 0.80 ms
在这种简单输出内容里,整行内容都包含于$HOSTOUTPUT$或$SERVICEOUTPUT$宏里面(取决于这个插件是被用于主机检测还是被用于服务检测)。
插件一般返回性能数据的方式是在插件可读的输出行里加上管道符(|),后面跟一个或几个性能测量值。还是用check_ping插件做例子,假定用这种方式来返回性能数据,其插件输出内容象是这样:
PING ok - Packet loss = 0%, RTA = 0.80 ms | percent_packet_loss=0, rta=0.80
当Nagios处理象这样的输出内容格式时,将把它分为两部分:
- 管道符之前的内容被认为是"正常"的插件输出并保存于$HOSTOUTPUT$或是$SERVICEOUTPUT$宏里;
- 管道符之后的内容被认为是与性能数据相关的内容并保存于$HOSTPERFDATA$或是$SERVICEPERFDATA$宏里;
在上例中,$HOSTOUTPUT$或$SERVICEOUTPUT$宏的内容将是"PING ok - Packet loss = 0%, RTA = 0.80 ms"(没有引号),而$HOSTPERFDATA$或$SERVICEPERFDATA$宏将是"percent_packet_loss=0, rta=0.80"(没有引号)。
插件输出可以包含有多行的性能数据输出(也象正常正文输出),这个在插件API文档有介绍。
注意
如果想要Nagios和插件生成并处理性能数据,需要按下面来做:
- 打开process_performance_data选项开关;
- 配置Nagios以便于把性能数据要么写入文件要么执行一个数据处理命令;
查阅文档看如何把性能数据写入文件或是如何来执行数据处理命令;
在Nagios里最柔性化地处理性能数据的方式是使用命令来处理性能数据或是把数据重定向以便于外部应用来做后序处理。在Nagios里对主机和服务性能数据的处理命令分别取决于对host_perfdata_command和service_perfdata_command选项设置。
下例是重定向服务检测的性能数据到一个文本文件里以让其他应用来做后序处理:
define command{
	command_name	store-service-perfdata
	command_line	/bin/echo -e "$LASTSERVICECHECK$\t$HOSTNAME$\t$SERVICEDESC$\t$SERVICESTATE$\t$SERVICEATTEMPT$\t$SERVICESTATETYPE$\t$SERVICEEXECUTIONTIME$\t$SERVICELATENCY$\t$SERVICEOUTPUT$\t$SERVICEPERFDATA$" >> /usr/local/nagios/var/service-perfdata.dat
	}
提示
用host_perfdata_file和service_perfdata_file选项可以让Nagios直接把性能数据写入文本文件,而主机与服务性能数据的写入格式由host_perfdata_file_template和service_perfdata_file_template选项设置决定。
下例是个服务性能数据的格式设置:
service_perfdata_file_template=[SERVICEPERFDATA]\t$TIMET$\t$HOSTNAME$\t$SERVICEDESC$\t$SERVICEEXECUTIONTIME$\t$SERVICELATENCY$\t$SERVICEOUTPUT$\t$SERVICEPERFDATA$
默认情况下,文本文件以"追加"方式打开。如果想改变文件打开方式,如"写入"或是"非阻塞式读写"(用管道写文件时用的),可以设置host_perfdata_file_mode和service_perfdata_file_mode选项。
另外,还可以让Nagios定期地执行命令来定期处理性能数据文件(如滚动数据),用host_perfdata_file_processing_command和service_perfdata_file_processing_command选项设置。这些命令的执行间隔分别由host_perfdata_file_processing_interval和service_perfdata_file_processing_interval选项控制。